Research Publication Disclaimer: This article is an independent research and policy analysis produced by the research team of Di Tran University — The College of Humanization and is published by Louisville Beauty Academy (LBA) strictly in its original form for educational and public informational purposes. Louisville Beauty Academy does not edit, interpret, certify, validate, or formally endorse the conclusions, models, projections, or policy interpretations contained herein. All analysis, viewpoints, data interpretation, and academic opinions expressed are solely those of the Di Tran University research team. This publication is shared to encourage transparency, academic discussion, and public understanding of vocational education, workforce development, and student debt structures, and it should not be construed as legal advice, regulatory guidance, or official policy statements of Louisville Beauty Academy, its administration, instructors, or affiliates. All intellectual authorship and research credit belong exclusively to Di Tran University — The College of Humanization Research Team, and the document is presented as-is without institutional interpretation or endorsement by Louisville Beauty Academy.
The landscape of American post-secondary education and its attendant financial structures is currently undergoing a period of profound volatility and realignment. As of the fourth quarter of 2025, the national student loan debt has reached a historic zenith of approximately $1.833 trillion, with federal obligations accounting for 90.9% of the total.1 This fiscal burden is not distributed uniformly across the United States; rather, it exhibits significant geographical and sectoral concentrations that reveal systemic inefficiencies in the prevailing Title IV funding apparatus. While high-population states such as Florida and Georgia grapple with aggregate debt balances exceeding $112 billion and $74 billion respectively, the vocational sector—specifically cosmetology and personal care services—has emerged as a focal point of regulatory scrutiny due to its high debt-to-earnings ratios and reliance on federal subsidies.1
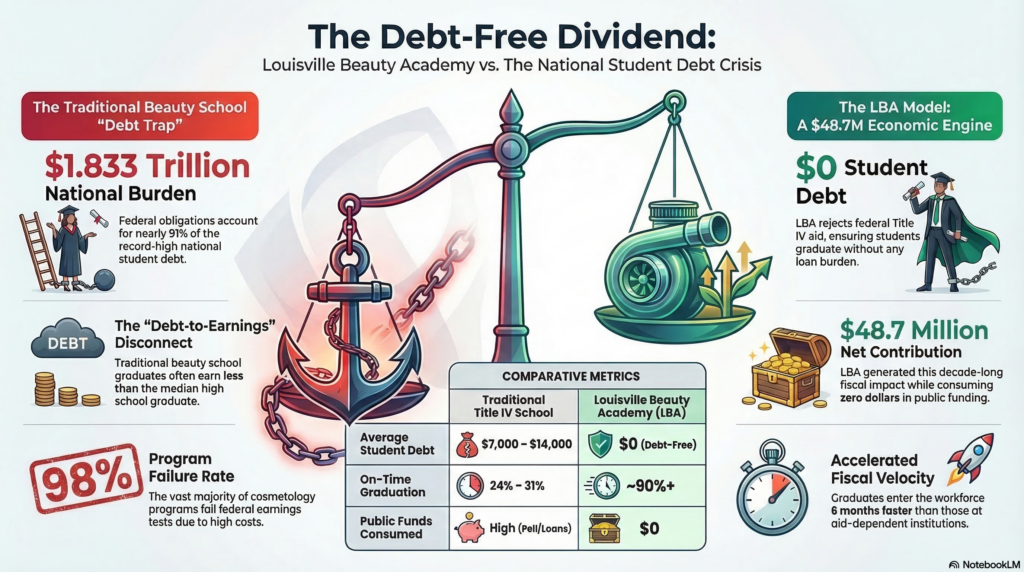
The implementation of the One Big Beautiful Bill Act (OBBBA) in July 2025 and the subsequent rollout of the Student Tuition and Transparency System (STATS) in 2026 represent a decisive shift toward outcomes-based accountability.5 This legislative pivot aims to address the “debt-to-earnings” disconnect that characterizes many vocational programs, where graduates frequently earn less than the median high school graduate despite carrying significant loan balances. In this environment, the Louisville Beauty Academy (LBA) in Kentucky provides a critical counter-narrative. By eschewing federal aid in favor of a low-tuition, lower-debt framework, LBA has demonstrated a net-positive fiscal contribution of approximately $48.7 million over the past decade.7 This analysis evaluates the macroeconomic drivers of the debt crisis, regional disparities between the Deep South and the Ohio Valley, and the scalability of the LBA model as a tax-positive solution for workforce development.
The National Student Loan Debt Trajectory (2024–2026)
The trajectory of student loan debt in the mid-2020s is characterized by a return to annual growth following a brief decline in the 2023–2024 period.2 Federal student loan debt increased by $54 billion in 2025 alone, with year-over-year quarterly growth averaging 2.94%.2 This resurgence in debt accumulation coincides with a period of heightened delinquency; as of the fourth quarter of 2025, approximately 9.57% of student loans were 90 days or more delinquent.8
The total borrower population remains steady at approximately 42.8 million individuals, but the average federal balance has climbed to a record high of $39,547.1 When private lending is integrated into the analysis, the average total balance for some cohorts may reach as high as $43,333.2 This escalation is particularly pronounced among Gen Z and younger Millennials, who saw the largest debt increases over the past year as they entered a labor market influenced by persistent inflation and shifting entry-level wage standards.9
National Student Loan Debt Metrics by Quarter (2024–2025)
| Quarter | Total National Debt (Trillions) | Federal Debt (Trillions) | YoY Change (%) |
| 2024 Q1 | $1.753 | $1.598 | -1.22% |
| 2024 Q2 | $1.741 | $1.620 | -1.14% |
| 2024 Q3 | $1.772 | $1.611 | 2.33% |
| 2024 Q4 | $1.778 | $1.638 | 2.85% |
| 2025 Q1 | $1.805 | $1.639 | 2.97% |
| 2025 Q2 | $1.813 | $1.660 | 4.16% |
| 2025 Q3 | $1.832 | $1.665 | 3.39% |
| 2025 Q4 | $1.835 | $1.692 | 3.30% |
Data source:.2
The surge in 2025 is attributed to several factors, including the expiration of pandemic-era payment pauses and the restructuring of repayment plans under the OBBBA. The average level of federal student loan debt has grown by roughly 1% per quarter since 2013, suggesting a structural upward pressure on tuition costs that outpaces general inflation.1 For many Americans, student loan payments now exceed their monthly retirement contributions or healthcare expenses.1
Geographical Analysis of High-Debt States: Florida and the Deep South
The student debt crisis exhibits significant regional variation, with the Southern United States bearing a disproportionate share of the national burden. High tuition costs in these regions frequently intersect with lower-than-average median earnings for recent graduates, creating a “debt trap” that hinders local economic mobility.
The Georgia Nexus: Prevalence and Burden
Georgia represents one of the most acute examples of educational indebtedness in the nation. It currently exhibits the highest rate of outstanding student loan debt prevalence nationwide, with 15.4% of the total population carrying a balance.4 The average borrower debt in Georgia is approximately $43,276, placing it second only to Maryland and the District of Columbia in terms of individual burden.4 The total aggregate debt for the state stands at $74.3 billion.4
The crisis in Georgia is further exacerbated by the demographics of its borrowers. Older Americans in Georgia (ages 50 and older) struggle significantly, with an average debt of $53,528—the third-highest in the nation for this age cohort.11 Approximately 8.7% of Georgia’s residents over 50 have student debt, a statistic that underscores the “intergenerational debt trap” where parents and grandparents assume Parent PLUS loans to finance the education of their descendants.8
The Florida Paradox: Population Density and Debt Accumulation
Florida represents one of the largest aggregate pools of student debt in the country, totaling approximately $112.4 billion as of 2026.4 With over 2.76 million borrowers, the state’s average balance is $40,697.4 Florida’s crisis is characterized by a “debt-to-earnings disconnect” in several of its major metropolitan areas. For example, in Gainesville, the average student loan debt of $44,508 exceeds the median annual earnings for residents with a bachelor’s degree ($41,782).12 This inversion of the traditional return-on-investment (ROI) model suggests that for many Floridians, higher education has become a net-negative wealth event in the early career stages.
| State | Average Borrower Debt (2025/26) | Total State Debt (Billions) | Population with Debt (%) |
| Maryland | $45,173 | $38.4 | 13.6% |
| Georgia | $43,276 | $74.3 | 15.4% |
| Virginia | $41,410 | $45.6 | 12.5% |
| Florida | $40,697 | $112.4 | 11.8% |
| Delaware | $40,290 | $5.6 | 13.1% |
| Illinois | $40,243 | $65.3 | 12.8% |
| New York | $40,207 | $99.6 | 12.5% |
| North Carolina | $39,914 | $55.4 | 12.6% |
Data source:.4
Regional Comparison: Kentucky and the Surrounding Region
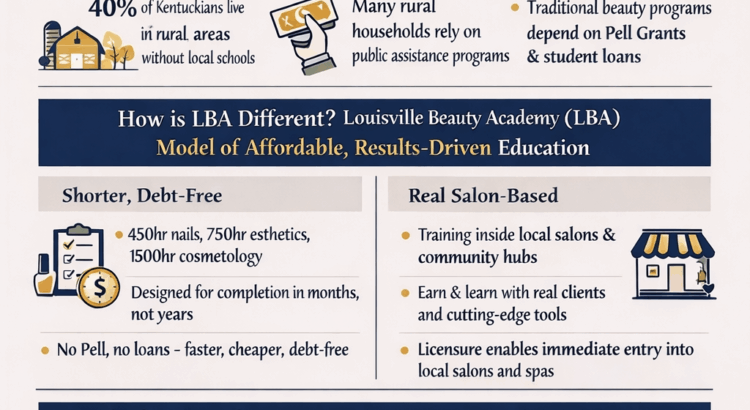
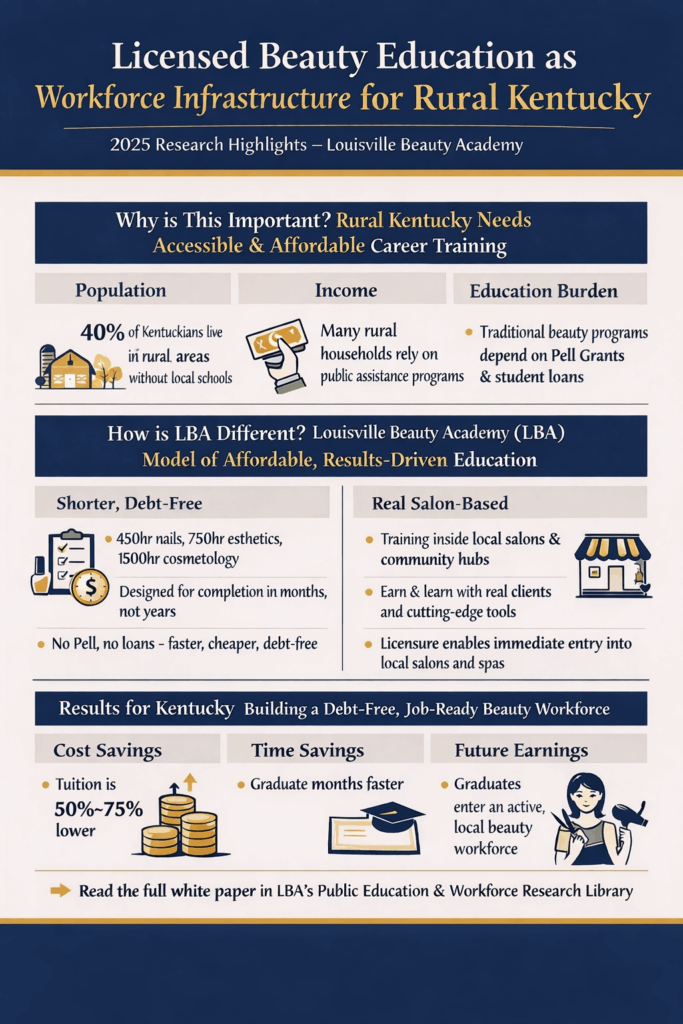
In contrast to the extreme burdens seen in the Deep South and Mid-Atlantic, Kentucky and its neighboring states in the Ohio Valley and Midwest present a more moderate, yet still concerning, debt profile. Kentucky’s average borrower debt is $33,691, with a total state debt of $20.7 billion.13 Approximately 13.4% of Kentucky residents carry student debt, which is largely consistent with the national average.13
Comparative Regional Statistics (2024–2025)
| State | Average Debt | Total State Debt (Billions) | Borrowers (Thousands) | % Under Age 35 |
| Illinois | $39,042 | $63.4 | 1,623.9 | 52.1% |
| Virginia | $40,287 | $44.3 | 1,099.6 | 50.8% |
| Tennessee | $37,054 | $33.1 | 893.3 | 48.8% |
| Missouri | $35,650 | $29.7 | 833.1 | 47.5% |
| Ohio | $35,072 | $62.6 | 1,784.0 | N/A |
| Kentucky | $33,691 | $20.7 | 614.4 | 47.8% |
| Indiana | $33,234 | $30.1 | 905.7 | 48.4% |
| West Virginia | $32,343 | $7.4 | 228.8 | 47.4% |
Data source:.13
West Virginia maintains the lowest average debt in the region at $32,343, which is also among the lowest in the nation.13 However, the prevalence of debt remains significant, affecting 12.9% of the population.13 Indiana and Kentucky exhibit remarkably similar profiles, with average debts hovering near $33,000 and nearly half of all borrowers being under the age of 35.13 This demographic concentration highlights the vulnerability of young professionals who are attempting to establish households and businesses while serviced by significant debt-to-income ratios. In Kentucky, specifically, 16.3% of indebted borrowers owe less than $5,000, while 1.61% owe more than $200,000.13
The Beauty Industry Crisis: Structural Inefficiency in Vocational Training
The personal care services industry, encompassing cosmetology, esthetics, and nail technology, represents a critical sector for regional economic development, yet it is currently mired in a “debt-extractive” cycle. Across the United States, more than 1,300 cosmetology schools serve approximately 230,000 students, generating over $2.2 billion in annual revenue.14 A significant portion of this revenue—upwards of $1 billion annually—is derived from federal student loans and Pell Grants.3
The ROI Disconnect in Cosmetology
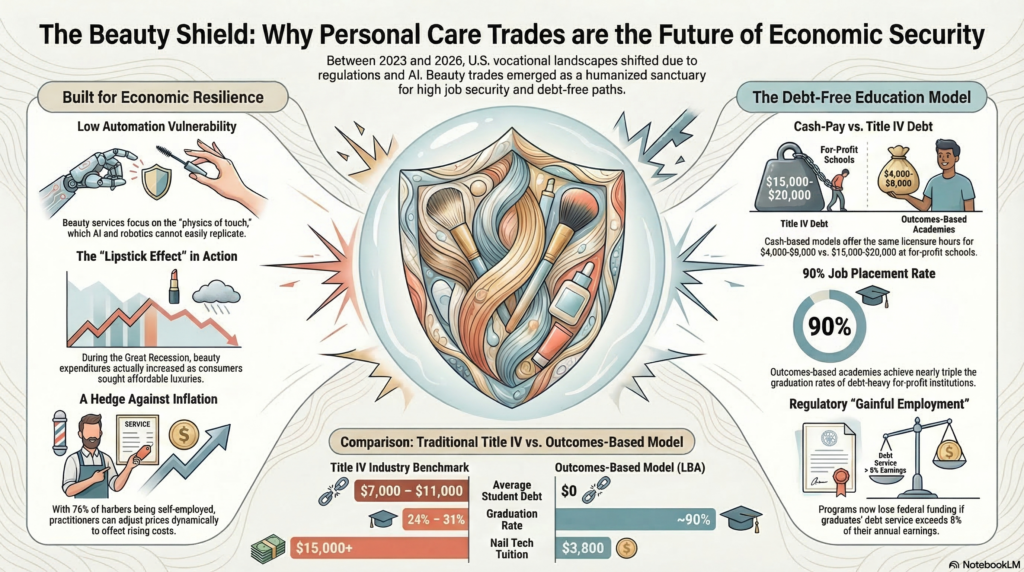
Research indicates that the return on investment for traditional cosmetology programs is frequently abysmal. Nationwide data show that graduates average only $16,600 to $26,000 in annual earnings, a figure that is often lower than that of high school graduates in other fields.14 Despite these low wages, the cost of training at Title IV-accredited schools often ranges from $15,000 to $25,000.15 This leads to an average student debt of approximately $10,000 for a credential that may not yield a salary higher than $20,000 annually four years after completion.14
| Metric | Traditional Title IV Beauty School | Louisville Beauty Academy (LBA) |
| Average Tuition Cost | $15,000 – $25,000 | $3,800 – $6,250 |
| Average Student Debt | $7,000 – $14,000 | $0 (Lower-Debt) |
| On-Time Graduation Rate | 24% – 31% | ~90%+ |
| Early Career Earnings | $16,000 – $26,000 | $20,000 – $43,000 |
| Public Funds Consumed | High (Pell/Loans) | $0 |
Data source:.5
The systemic failure of this model is evidenced by the fact that 75% to 98% of cosmetology programs would fail federal earnings tests, as their graduates do not earn more than a typical high school graduate in their respective states.15 Furthermore, beauty schools are disproportionately represented on the U.S. Department of Education’s “heightened cash monitoring” list, with many institutions flagged for financial mismanagement or failure to meet accreditor standards.16
Perverse Incentives and Artificial Program Lengths
The reliance on federal aid has created perverse incentives for for-profit beauty schools to extend program lengths. In many states, licensing mandates range from 1,000 to 1,500 hours.14 Schools often lobby to maintain these high hourly requirements to maximize the amount of Title IV funding they can collect per student.15 This practice, combined with the use of students as unpaid labor on school clinic floors, creates a “dual-revenue” model that prioritizes institutional profit over student outcomes.14
Investigations have revealed that many schools discourage on-time graduation because doing so would curtail the period during which they can draw federal aid.14 Consequently, less than one-third of cosmetology students graduate within the nominal program length, leading to higher attrition and a greater probability of loan default.14 At some for-profit conglomerate beauty schools, approximately 90% of cosmetology graduates fail to make more than what they would have with only a high school diploma.16
Legislative Transformation: The OBBBA 2025 and STATS Framework
On July 4, 2025, the One Big Beautiful Bill Act (OBBBA) was signed into law, initiating a comprehensive restructuring of the federal student aid, tax, and social safety net systems.5 Taking full effect on July 1, 2026, the legislation introduces a rigorous accountability framework centered on the Student Tuition and Transparency System (STATS).5
The Earnings Premium (EP) Test
The core of the new regulatory regime is the Earnings Premium (EP) test. This evaluation determines whether graduates of a specific program earn at least as much as a typical high school graduate in the same state.5 For the 2026-2027 award year, these benchmarks are calculated using Census Bureau data adjusted for inflation to June 2025 dollars.5 Programs that fail this test in two out of three consecutive years lose their eligibility to participate in federal loan programs for two years.5
Under the STATS framework, the Department of Education has eliminated the Debt-to-Earnings (DTE) metric in favor of this single, uniform EP standard.5 This transition aims to simplify accountability but creates a high-stakes environment for vocational schools. Effective December 7, 2025, a “Lower-Earnings Indicator” was implemented directly into the FAFSA Submission Summary, displaying flagged institutions in red to warn prospective students.5
The Repayment Assistance Plan (RAP) and Repayment Restructuring
The OBBBA also replaces several income-driven repayment options, including the SAVE and PAYE plans, with the new Repayment Assistance Plan (RAP).5 The RAP is generally less forgiving for low-income borrowers; it implements a minimum monthly payment of approximately $10 even for those with the lowest incomes, whereas previous plans allowed for $0 payments.16
| Annual Income | Monthly Payment (SAVE Plan) | Monthly Payment (RAP Plan) |
| $15,000 | $0 | $10.00 |
| $20,000 | $0 | $16.67 |
| $20,500 | $0 | $34.17 |
| $30,000 | $22.50 | $75.00 |
Data source:.5
This restructuring increases the financial vulnerability of cosmetology graduates. For example, a graduate making just $20,500 per year would see their monthly payment more than double compared to one making $20,000, despite only a 3% increase in income.16 Additionally, the bill eliminates economic hardship and unemployment deferments, which previously allowed borrowers to pause payments during periods of financial insecurity.16
Broader Policy Impacts of the OBBBA
Beyond education, the OBBBA makes sweeping changes to other sectors. It includes $3.8 trillion in tax cuts, extending the 2017 Tax Cuts and Jobs Act (TCJA) and increasing the child tax credit to $2,500 through 2028.18 For small businesses, it restores 100% bonus depreciation for equipment acquired after January 19, 2025, and increases Section 179 investment ceilings to $4 million.19
In the agricultural sector, the bill increases reference prices for commodities by 10-21% and establishes the Farmer Bridge Assistance (FBA) Program to provide $12 billion in relief for market disruptions.20 However, the bill also implements significant cuts to Medicaid and SNAP, including strict work requirements of 80 hours per month for able-bodied adults aged 19-64.17 These cuts, totaling about $700 billion for Medicaid, represent the largest in the program’s history and may force millions of children and low-wage workers off health coverage.18
The Louisville Beauty Academy: A Lower-Debt, Tax-Positive Alternative
Situated within the Kentucky regulatory ecosystem, the Louisville Beauty Academy (LBA) operates as a primary case study for an alternative vocational model. By rejecting Title IV federal aid, LBA avoids the regulatory pitfalls of the OBBBA and the debt trap that characterizes the traditional beauty school sector.3
Fiscal Velocity and Speed-to-Market
The LBA model is predicated on the concept of “fiscal velocity”—the speed at which a student transitions from a consumer of public resources to a net tax contributor.22 While traditional schools often extend the 1,500-hour cosmetology program to 15 or 18 months to satisfy federal aid requirements, LBA’s model targets completion in 9 to 10 months.22 This creates a “speed-to-market differential” () of approximately 6 months (0.5 years).
Using a standardized mathematical model, the impact of this velocity can be quantified. By entering the workforce six months earlier, a graduate earns an additional $15,000 in professional income (based on an entry-level salary of $30,000).22 At a conservative 16% aggregate effective tax rate (), each LBA graduate generates $2,400 in extra tax revenue during that six-month window.22 For a cohort of 100 graduates, this results in a $240,000 recurring tax premium for the public treasury.22
Mathematical Modeling of Net Fiscal Impact
The total taxpayer savings () per student can be expressed through the following formulation:

Where:
= The average public aid package avoided (e.g., $10,000 in Pell Grants and loans).
= The interest on avoided debt that would have been borne by the taxpayer in the event of default or subsidy.
For every 100 students who choose LBA over a traditional aid-dependent school, the model generates $1,000,000 in direct taxpayer savings.22 Over a five-year projection with a modest 7.5% growth rate, the LBA model “saves” the public treasury approximately $5.8 million.22
The $48.7 Million Economic Engine: A Decade of Contribution
Over the past ten years, LBA has produced approximately 2,000 licensed beauty professionals and incubated roughly 30 independently owned salons.7 The cumulative fiscal and tax contribution of this model, while consuming exactly zero dollars in public education funding, is estimated at $48,699,250.7
Breakdown of the $48.7 Million Contribution (10-Year Totals)
| Category | Calculation | 10-Year Total |
| Federal Income Tax | 10% effective rate on $200M graduate income | $20,000,000 |
| Payroll Taxes (FICA) | 7.65% on $230M total employment income | $17,595,000 |
| Kentucky State Income Tax | 4% on $200M graduate income | $8,000,000 |
| Federal/State Tax on Salon Profits | 20% margin | $1,680,000 |
| Sales Tax | 6% on estimated 15% retail portion of $60M | $540,000 |
| Direct State Board Fees | Exams, licensing, and renewals | $884,250 |
| TOTAL CONTRIBUTION | $48,699,250 | |
| Public Funds Consumed | $0 |
Data source:.7
This $48.7 million figure represents a “net-positive” reality. If LBA had operated as a typical Title IV school, it would have consumed approximately $9 million in Pell Grants and disbursed $16 million in federal student loans—a total federal cost of $25 million.7 The net fiscal difference between the LBA model and the industry standard is $73.7 million over a decade.7
Business Incubation and the Entrepreneurial Multiplier
The absence of a “debt overhang” significantly increases the probability of business formation among LBA graduates. Research from the Federal Reserve suggests that student debt reduces the likelihood of business formation by 11% to 14%.23 LBA graduates, carrying zero debt, exhibit higher risk tolerance and capital availability.
The model uses an employment multiplier of 1.5, accounting for the additional jobs (receptionists, assistants, etc.) created when lower-debt graduates launch their own ventures.22 For a pool of 500 graduates, the LBA model is projected to create 125 new businesses and 312.5 total jobs—a performance ratio 2.08 times higher than that of debt-burdened competitors.23
Regulatory Over-Compliance and the “Gold-Standard” Model
The Louisville Beauty Academy distinguishes itself not only through its financial structure but also through its “Compliance-By-Design” framework. This is particularly relevant given the recent oversight failures identified within the Kentucky Board of Cosmetology (KBC).
The 2024 Legislative Oversight Findings
A 2024 report by the Kentucky Legislative Oversight and Investigations Committee (LOIC) found that the KBC was failing to meet its regulatory mandate to inspect establishments twice annually.25 In a sample of board files, only 54% had a completed inspection form, and staff expressed confusion regarding the implementation of emergency orders.26 The board was found to have no oversight in its complaint and disciplinary processes and lacked policies for mass communication or continuing education.26
In response to this administrative instability, LBA has positioned itself as a center for “regulatory over-compliance.” The academy facilitates one of the highest exam participation volumes in the Commonwealth, with over 600 exam events documented between 2023 and 2025.24 It is the #1 school in Kentucky for nail technology licensing volume and facilitates more theory retake events than any other institution, demonstrating a commitment to “ultimate licensure” rather than mere enrollment.24
Modernization and the 2026 Direction
As of early 2026, LBA has transitioned to what it terms the “Gold-Standard Model,” powered by Di Tran University’s College of Humanization.28 This model focuses on three pillars:
- Sanitation and Safety Law: Prioritizing public health as the primary purpose of licensure.
- Practical Skill Proficiency: Utilizing repetitive, safety-centered tasks to build “muscle memory” and procedural competence.29
- Humanized Business Practices: Integrating AI and digital tools to streamline administration and enhance educational delivery.3
Top 10 Kentucky Schools by Combined Exam Participation (2023–2025)
| Rank | Institution | Total Exam Events | Primary Sub-Sector Strength |
| 1 | Paul Mitchell The School Louisville | 682 | General Cosmetology / Esthetics |
| 2 | Louisville Beauty Academy | 614 | Nail Technology / Multilingual |
| 3 | Empire Beauty School – Chenoweth | 345 | Cosmetology |
| 4 | Empire Beauty School – Dixie | 192 | Cosmetology |
| 5 | The Beauty Institute | 128 | Cosmetology |
| 6 | KCTCS – Somerset | 105 | Rural Cosmetology |
| 7 | Madisonville Beauty College | 94 | Regional Cosmetology |
| 8 | Campbellsville University | 88 | Academic/Vocational Mix |
| 9 | Berea Beauty Academy | 72 | Regional Cosmetology |
| 10 | Lindsey Institute of Cosmetology | 68 | Regional Cosmetology |
Data source:.27
Conclusion: Scalability and Policy Implications
The analysis of student debt in high-burden states like Florida and Georgia reveals a structural failure in the current vocational education paradigm. The reliance on federal Title IV funding has incentivized long program lengths, high costs, and poor student outcomes, leading to a national crisis where over 8.8 million borrowers are in default.2 The OBBBA of 2025 attempts to correct these issues through the STATS framework and the Earnings Premium test, but its implementation risks further marginalizing the lowest-income graduates who will face higher repayment burdens under the RAP plan.5
The Louisville Beauty Academy model provides a documented, tax-positive solution to this crisis. By focusing on lower-debt graduation, accelerated workforce entry, and high-volume licensure attainment, LBA transforms the vocational student from a potential taxpayer liability into a significant economic contributor. The $48.7 million net-positive impact of a single-campus institution suggests that if this template were scaled nationally, the “savings” to the public treasury would be in the billions of dollars. For policymakers, the success of LBA suggests a need to shift the focus of accreditation and aid from legacy inputs to measurable outcomes, fostering a more resilient and entrepreneurial workforce for the 2030s.
Works cited
- Student Loan Debt 2025: Statistics, Forgiveness, and Outlook | The Motley Fool, accessed March 15, 2026, https://www.fool.com/research/student-loan-debt-statistics/
- Student Loan Debt Statistics [2026]: Average + Total Debt – Education Data Initiative, accessed March 15, 2026, https://educationdata.org/student-loan-debt-statistics
- Beauty School Financial Transparency Report (2026):Understanding Federal Aid Models and Lower-Debt Vocational Education – RESEARCH & PODCAST 2026 – Louisville Beauty Academy, accessed March 15, 2026, https://louisvillebeautyacademy.net/beauty-school-financial-transparency-report-2026understanding-federal-aid-models-and-lower-debt-vocational-education-research-podcast-2026/
- Student Loan Debt by State – 2026 Study – SmartAsset.com, accessed March 15, 2026, https://smartasset.com/data-studies/student-loan-debt-2026
- One Big Beautiful Bill Act education Archives – Louisville Beauty Academy, accessed March 15, 2026, https://louisvillebeautyacademy.net/tag/one-big-beautiful-bill-act-education/
- Professional Analysis of the Regulatory Convergence: Kentucky Board of Cosmetology Compliance and Federal Accountability Standards (2024-2026) – RESEARCH & PODCAST SERIES 2026 – Di Tran University, accessed March 15, 2026, https://ditranuniversity.com/professional-analysis-of-the-regulatory-convergence-kentucky-board-of-cosmetology-compliance-and-federal-accountability-standards-2024-2026-research-podcast-series-2026/
- $48.7 million net positive contribution Archives – Louisville Beauty …, accessed March 15, 2026, https://louisvillebeautyacademy.net/tag/48-7-million-net-positive-contribution/
- U.S. Student Loan Debt Statistics | LendingTree, accessed March 15, 2026, https://www.lendingtree.com/student/student-loan-debt-statistics/
- Average American Debt by Age, US State, Credit Score and Type in 2025 – Experian, accessed March 15, 2026, https://www.experian.com/blogs/ask-experian/research/consumer-debt-study/
- Americans Have the Most Student Loan Debt in These States – 2025 Study – SmartAsset, accessed March 15, 2026, https://smartasset.com/data-studies/student-loan-debt-2025
- Where Older Americans Struggle Most With Student Debt – 2022 Study – SmartAsset, accessed March 15, 2026, https://smartasset.com/data-studies/where-older-americans-struggle-most-with-student-debt-2022
- Where Student Loan Debt Hits the Hardest – 2019 Edition – SmartAsset, accessed March 15, 2026, https://smartasset.com/checking-account/where-student-loan-debt-hits-the-hardest-2019
- Student Loan Debt by State [2025]: Average + Total Debt, accessed March 15, 2026, https://educationdata.org/student-loan-debt-by-state
- Outcomes-Based Beauty Education : A Workforce and Policy …, accessed March 15, 2026, https://naba4u.org/2025/12/outcomes-based-beauty-education-a-workforce-and-policy-analysis-of-lower-debt-completion-driven-vocational-models-research-december-2025/
- Federal Aid, Licensure, and the Debt Crisis in Cosmetology Education – RESEARCH 2025, accessed March 15, 2026, https://naba4u.org/2025/12/federal-aid-licensure-and-the-debt-crisis-in-cosmetology-education-research-2025/
- What the One Big Beautiful Bill Means for Cosmetology Students …, accessed March 15, 2026, https://www.newamerica.org/insights/what-the-one-big-beautiful-bill-means-for-cosmetology-students/
- One Big Beautiful Bill Law Summary | ASTHO, accessed March 15, 2026, https://www.astho.org/advocacy/federal-government-affairs/leg-alerts/2025/one-big-beautiful-bill-law-summary/
- How the House-Passed Reconciliation Bill Would Negatively Impact Young Children and Their Families – New America, accessed March 15, 2026, https://www.newamerica.org/insights/how-the-house-passed-reconciliation-bill-would-negatively-impact-young-children-and-their-families/
- One Big Beautiful Bill Act resource center – Wolters Kluwer, accessed March 15, 2026, https://www.wolterskluwer.com/en/know/one-big-beautiful-bill-act
- Trump Administration Announces $12 Billion Farmer Bridge Payments for American Farmers Impacted by Unfair Market Disruptions | USDA, accessed March 15, 2026, https://www.usda.gov/about-usda/news/press-releases/2025/12/08/trump-administration-announces-12-billion-farmer-bridge-payments-american-farmers-impacted-unfair
- One Big Beautiful Bill Act Fails Students and Our Education System – New America, accessed March 15, 2026, https://www.newamerica.org/insights/one-big-beautiful-bill-act-fails-students-and-our-education-system/
- local economic impact study Kentucky Archives – Louisville Beauty …, accessed March 15, 2026, https://louisvillebeautyacademy.net/tag/local-economic-impact-study-kentucky/
- Tag: Kentucky beauty industry data, accessed March 15, 2026, https://louisvillebeautyacademy.net/tag/kentucky-beauty-industry-data/
- Tag: licensed cosmetology graduates Kentucky – Louisville Beauty Academy, accessed March 15, 2026, https://louisvillebeautyacademy.net/tag/licensed-cosmetology-graduates-kentucky/
- Louisville Beauty Academy case study Archives, accessed March 15, 2026, https://louisvillebeautyacademy.net/tag/louisville-beauty-academy-case-study/
- Board Of Cosmetology Oversight Functions – Legislative Research Commission, accessed March 15, 2026, https://apps.legislature.ky.gov/lrc/publications/ResearchReports/RR492.pdf
- Tag: Kentucky vocational education reform – Louisville Beauty Academy, accessed March 15, 2026, https://louisvillebeautyacademy.net/tag/kentucky-vocational-education-reform/
- Louisville Beauty Academy Regulatory Update 2026 Archives, accessed March 15, 2026, https://louisvillebeautyacademy.net/tag/louisville-beauty-academy-regulatory-update-2026/
- Louisville Beauty Academy model Archives, accessed March 15, 2026, https://louisvillebeautyacademy.net/tag/louisville-beauty-academy-model/
- January 2026 Default Crisis Fact Sheet – Protect Borrowers, accessed March 15, 2026, https://protectborrowers.org/resource/default-crisis-fact-sheet-jan-2026/
Research Disclaimer and Institutional Attribution
The following publication is an independent academic and policy research document produced by the research team of Di Tran University — The College of Humanization. Louisville Beauty Academy (LBA) is publishing this material in its original form solely for educational, informational, and public policy discussion purposes.
Louisville Beauty Academy does not edit, reinterpret, certify, validate, or formally endorse the conclusions, models, projections, or policy interpretations contained within this research. All analytical frameworks, statistical interpretations, economic projections, and policy discussions presented in this publication are the intellectual work and responsibility of the Di Tran University research team.
This document is shared in the spirit of transparency, workforce education, and open academic discussion regarding vocational training, student debt structures, regulatory environments, and economic development within the beauty and personal care industry.
The publication should not be interpreted as legal advice, regulatory guidance, financial advice, or official policy statements from Louisville Beauty Academy, its administration, instructors, staff, or affiliates. Readers are encouraged to consult appropriate licensed professionals or regulatory authorities when seeking formal interpretation of laws, regulations, educational standards, or financial matters referenced in this research.
The inclusion of Louisville Beauty Academy as a case study within this research reflects publicly available information and independent analysis conducted by the Di Tran University research team. Any mention of institutions, policies, regulatory bodies, or educational models is part of broader academic analysis and does not constitute criticism, endorsement, or official position statements by Louisville Beauty Academy.
By publishing this document, Louisville Beauty Academy affirms its commitment to open academic dialogue, transparency in vocational education, and the sharing of research that contributes to public understanding of workforce development and economic mobility.
All intellectual credit, authorship, and analytical responsibility belong exclusively to:
Di Tran University
The College of Humanization
Research and Policy Analysis Team
Louisville Beauty Academy publishes this research as-is, without modification, interpretation, or institutional endorsement.