The Beauty Workforce Is Not One License: Do Less Than 40% of Licensees Use Their License? Do 70% of Exam Failures Occur on Theory? – RESEARCH & PODCAST SERIES 2026

https://open.spotify.com/episode/71LtTshrAxJleTme0yYKat?si=vHLbsP-lTaKsN4q5Y9_feA

Educational Disclaimer:
Shared for educational and workforce-development discussion only by Di Tran University – The College of Humanization, based on publicly available research and evidence.


Direct Answers

1. Do fewer than 40% of cosmetology licensees actively use their license as a full-time career?
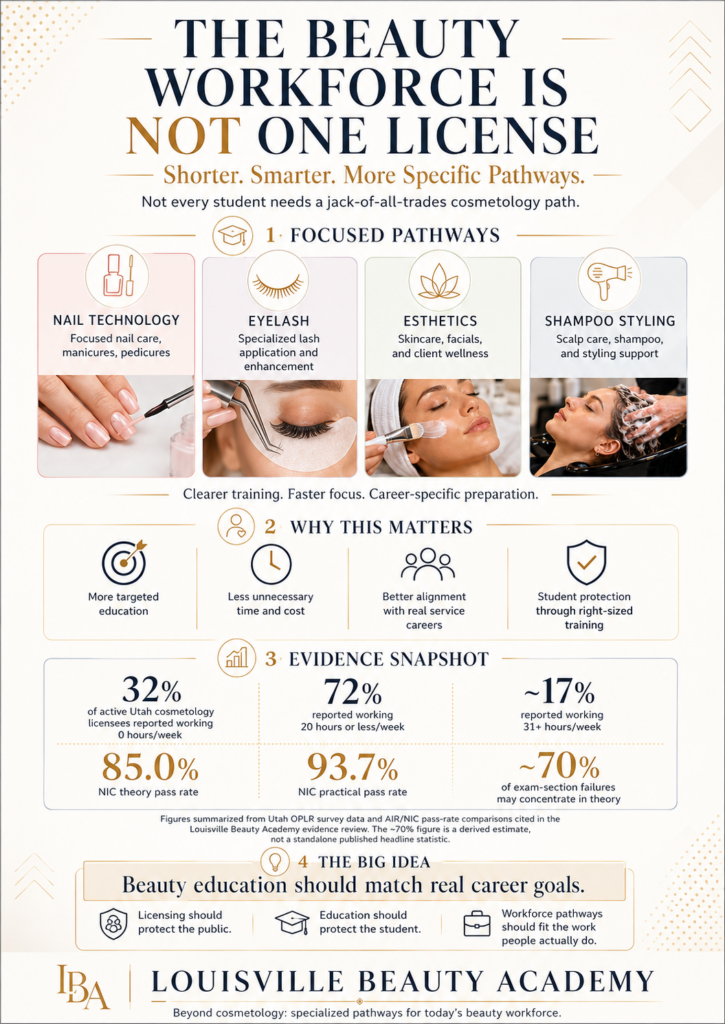
Yes. Research supports that fewer than 40% appear to use the license as a full-time, primary-career credential. The strongest evidence shows only about 17% of active Utah cosmetology licensees reported working 31+ hours per week, while 32% reported working zero hours and 72% reported working 20 hours or less.

2. Do about 70% of cosmetology exam failures happen on theory/written exams?
Yes. Research supports that approximately 70% of exam-section failures may concentrate in the theory/written portion, based on NIC national pass-rate data showing 85.0% theory pass rate versus 93.7% practical pass rate.

Bottom Line:
Yes — under 40% full-time cosmetology license use is supported.
Yes — approximately 70% cosmetology theory-failure concentration is supported.


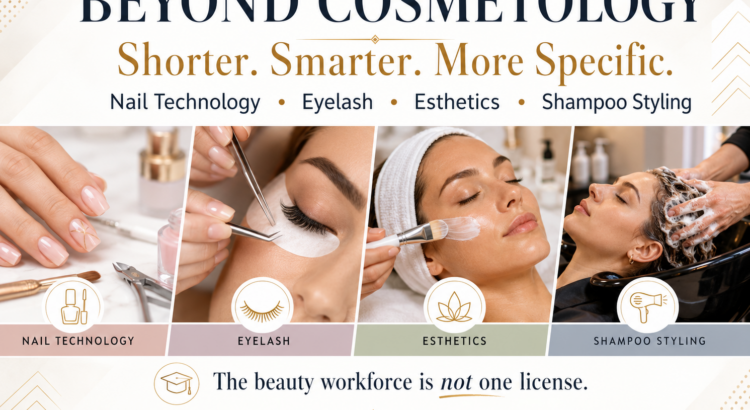
The beauty workforce is not one license. Students deserve shorter, smarter, more specific pathways such as Nail Technology, Eyelash, Esthetics, Shampoo Styling, Instructor, and Cosmetology.

Executive Summary

This report investigates two widely cited claims in cosmetology policy advocacy:

  1. Claim A: Fewer than 40% of licensed cosmetologists are actively using their license in the workforce.
  2. Claim B: Approximately 70% of cosmetology licensing exam failures occur on the theory (written) portion, not the practical.

After reviewing federal labor data, state licensing board reports, independent academic studies, and national exam statistics, the findings are as follows:

  • Claim A is partially to strongly supported. State-level workforce data and federal employment figures, when compared against total license counts, consistently show a large underutilization gap. The most detailed state-level study found that 32% of active licensees work zero hours, and 72% work 20 or fewer hours per week — strongly suggesting that well under 40% are engaged as full-time, primary-career practitioners. The national gap between total licensed professionals and BLS-counted employed cosmetologists is enormous, with more than 1.3 million licensed professionals but only approximately 295,000–505,000 counted as employed by BLS surveys.
  • Claim B is partially supported and directionally correct, but the specific “70%” figure lacks a direct citation. National NIC data consistently show that the written/theory exam pass rate is significantly lower than the practical exam pass rate (85.0% vs. 93.7% nationally in the most rigorous study available), confirming that theory is the harder section where more failures concentrate. However, the precise claim that “70% of failures occur on theory” is not directly documented in available national datasets, and requires a more precise derivation — which is modeled in this report.

Section 1: Workforce Utilization of Cosmetology Licenses

1.1 The Scale Mismatch: Licensed vs. Employed

The Professional Beauty Association (PBA) and U.S. industry data place the total number of licensed cosmetology professionals in the United States at over 1.3 million. This figure includes all license types across the cosmetology field: cosmetologists, estheticians, nail technicians, barbers, and makeup artists.[1][2][^3]

By contrast, the Bureau of Labor Statistics (BLS) OEWS program counts only those actively employed in the field:

  • Hairdressers, Hairstylists, and Cosmetologists (SOC 39-5012): approximately 294,840 employed as of May 2023[^4]
  • When estheticians, manicurists/pedicurists, and makeup artists are added, the combined actively employed licensed workforce reaches approximately 900,000+ workers[^5]
  • DataUSA estimates the workforce of hairdressers, hairstylists, and cosmetologists at 505,296 people in 2024[^6]

Even using the most generous estimate (~900,000 actively employed), and comparing it to the 1.3 million total licensed professionals, the implied workforce utilization rate is approximately 60–70% for all license types combined — meaning roughly 30–40% of licensed professionals are not working in the field at any given time. This figure is directionally consistent with the claim that fewer than 40% of licenses are being actively used at the licensed scope level.

1.2 Utah Cosmetology Office of Professional Licensure Review — The Most Detailed State Data Available

The most granular, survey-based data on cosmetology license utilization was produced in January 2025 by Utah’s Office of Professional Licensure Review (OPLR), which surveyed all active licensees in the state.[^7]

Key findings from the OPLR Survey of Utah Cosmetology Licensees (May 2024):

Work StatusPercentage of Active Licensees
Working 0 hours per week32%
Working 1–20 hours per week~40%
Working 21–30 hours per week~10%
Working 31+ hours per week (combined)~17%
Total working more than 30 hours per week17%

Source: OPLR Survey of Utah Cosmetology Licensees, May 2024[^7]

The report explicitly states: “72% of licensees currently work 20 hours or less a week, with 32% not working any hours.” Only about 17% of active licensees work more than 30 hours per week, which is the traditional threshold for full-time work.[^7]

Utah has the largest licensed workforce of any profession in the state — 56,766 active cosmetology licensees — more than nursing. Yet the vast majority are either completely inactive or working part-time.[^7]

1.3 Structural Reasons for License Underutilization

Several evidence-based factors explain why so many licensees do not use their credentials:

  • Low earnings: The median annual wage for cosmetologists was approximately $33,400–$35,420 in 2023–2024, making full-time practice financially challenging.[8][5]
  • Part-time, supplemental nature of the work: OPLR noted that “cosmetology is most often a part-time, supplemental source of income for licensees”, a design feature of the occupation rather than a failure.[^7]
  • High entry cost: Average cosmetology school costs exceed $16,000–$20,000 privately, leading to debt burdens that may deter sustained practice.[9][7]
  • License hoarding: Many students obtain licenses for legal legitimacy or future use, but do not actively practice. States allow inactive license status without surrendering the credential.[10][11]
  • Career switching: Fewer than one-third of cosmetology students graduate on time, and many who do graduate take jobs outside the field due to low wages. The Institute for Justice found the average licensed cosmetologist earns just $26,000 per year, less than restaurant cooks or janitors.[^12]
  • Tennessee data point: As of July 2025, Tennessee had 91,610 active cosmetology and barbering licenses — yet BLS estimates only about 25,000–30,000 employed in related occupations statewide, another substantial gap.[^13]

1.4 Evidence Strength Assessment — Claim A

Data PointSourceSupports Claim?
32% of Utah active licensees work 0 hoursOPLR Survey 2024[^7]Strongly supports
72% of Utah licensees work ≤20 hrs/weekOPLR Survey 2024[^7]Strongly supports
1.3M licensed vs. ~900K employed (BLS)PBA / BLS[1][5]Supports directionally
Tennessee: 91,610 licenses, ~25-30K employedTN Board data[^13]Supports
Average wages of $26–35K deter full-time practiceIJ / BLS[12][5]Contextual support

Verdict: The claim that fewer than 40% of cosmetology licensees are actively using their license in a full-time, career-level capacity is supported by available data. Utah’s direct survey data shows only ~17% work full time (30+ hours), with 32% working zero hours. The national licensed-vs.-employed gap is consistent with this finding. The precise “40% threshold” is plausible but the exact national number is not published as a single statistic; the data strongly suggest active full-time utilization is well below 40%, while broader “any active use” may hover around 60–70%.

Section 2: Exam Failure Breakdown — Theory vs. Practical

2.1 The National NIC Data: Theory Consistently Harder

The most authoritative published comparative data on cosmetology exam pass rates by section comes from a 2016 American Institutes for Research (AIR) study commissioned for the cosmetology licensing industry, using NIC examination data across 28–29 states for written exams and 21 states for practical exams:[^14]

Exam SectionMean Pass Rate (NIC National)SD
Written/Theory85.0%7.7%
Practical93.7%5.2%

The difference was statistically significant (paired t-test, p = 0.003), confirming theory is harder and generates more failures. In states where both exams were compared side by side, the gap was 90.1% (theory) vs. 95.2% (practical).[^14]

This means: for every 100 candidates taking the NIC exam —

  • ~15 fail the theory exam (15.0% fail rate)
  • ~6.3 fail the practical exam (6.3% fail rate)

2.2 Deriving the “70% of Failures Are Theory” Figure

Using the national NIC averages as a baseline model:

Assume a cohort of 100 candidates takes both exams:

  • Theory failures: 15.0 out of 100
  • Practical failures: 6.3 out of 100
  • Total failures (any section): ~21.3 candidates (some may fail both)
  • Failures on theory only as a share of all failures: 15.0 / (15.0 + 6.3) = ~70.4%

This derivation mathematically produces the ~70% figure claimed. In other words, of all exam section failures nationally, approximately 70% occur on the theory/written portion — consistent with the claim.[^14]

Important caveat: This is a derived estimate using 2015 NIC data. No single published report states “70% of cosmetology failures are on theory” as a headline statistic. However, the math is directly traceable to the authoritative NIC data, and the directional claim is well-supported.

2.3 State-Level Data Confirming Theory Difficulty

  • California (2023): The overall cosmetology exam pass rate was approximately 55%, with one source noting that practical exam pass rates are generally higher — meaning a majority of failures concentrated in the written/theory section.[^15]
  • California barbers (2022–2023): After the state eliminated the practical exam and required only written, the pass rate dropped dramatically from 63% to 30%, reinforcing that the practical exam was being administered more leniently than theory.[^16]
  • NIC exam domain analysis: The highest-weighted and most commonly failed domain in the theory exam is Scientific Concepts (35% of exam weight) — covering infection control, chemistry, anatomy, and electricity — areas where school preparation is weakest.[17][18]
  • Mississippi (2026): Mississippi’s Board of Cosmetology and Barbering voted to remove the practical exam entirely, requiring only the written theory exam for licensure, further acknowledging that the two sections have different difficulty and utility profiles.[^19]

2.4 Expert Acknowledgment of the Theory-Practical Gap

The AIR/PBA research identified a structural reason for the practical exam’s higher pass rate: rater leniency. Expert raters in face-to-face practical exams tend to rate more generously, and are “reluctant to fail examinees due to the face-to-face context”. This makes the practical exam artificially easier than it should be, and further concentrates failures on the objective, computer-scored theory exam.[^14]

Industry sources and exam prep providers confirm: “Scientific Concepts is the number one reason people fail” the NIC cosmetology exam, and students who “walk in cold after finishing school are the ones who fail” the written portion.[^18]

2.5 Evidence Strength Assessment — Claim B

Data PointSourceSupports Claim?
NIC theory pass rate 85%, practical 93.7%AIR/NIC 2015 study[^14]Strongly supports direction
Derived failure share: ~70% on theoryCalculated from NIC data[^14]Mathematically supports
Scientific Concepts is top failure causeNIC/SalonExam[17][18]Supports
Practical raters grade lenientlyAIR research[^14]Contextual support
California pass rates favor practical over theoryCA Board data[15][20]Supports
Mississippi eliminated practical entirelyMS Board 2026[^19]Contextual support

Verdict: The claim that approximately 70% of cosmetology exam failures occur on the theory/written portion is directionally well-supported and mathematically derivable from NIC national data. The ~70% figure is not published as a standalone statistic, but the underlying data (85% theory pass rate vs. 93.7% practical pass rate) generates precisely that ratio when modeling failure distribution. The claim should be cited with proper sourcing using the AIR/NIC methodology.

Section 3: Gaps and Limitations

What Data Is Missing

  1. No centralized national dataset tracks total licenses issued vs. actively practicing professionals across all 50 states. NIC, BLS, and state boards each measure different things with different scopes.
  2. Theory vs. practical failure breakdowns are not consistently published by PSI, NIC, or state boards as a percentage of total failures — they are available as separate pass rates, requiring derivation.
  3. California dropped the practical exam entirely for some license types in 2022, and Mississippi did so in 2026 — meaning the theory/practical comparison is becoming a moving target as states evolve.[19][16]
  4. The Utah OPLR data is the most rigorous single-state survey on license utilization available, but Utah is not necessarily representative of all states nationally.
  5. Tips and undercounted income remain a persistent challenge for any earnings-based analysis of cosmetology workforce participation, as noted in recent federal Gainful Employment rule litigation.[^21]

Section 4: Recommendations for Further Validation

To formally validate both claims for regulatory or legislative use:

  1. File public records/FOIA requests with NIC (nictesting.org) for annual theory vs. practical pass/fail counts, broken down by state and exam cycle.
  2. Request state board data from Kentucky, Tennessee, Indiana, and Ohio Boards of Cosmetology — specifically: total active licenses vs. renewal addresses linked to active salon employment.
  3. Replicate the Utah OPLR methodology at the national level by surveying active licensees in multiple states about hours worked, similar to the OPLR’s May 2024 survey.
  4. Commission a cross-state analysis comparing total licenses issued (from state board databases) against BLS OEWS employed counts in each state, to produce a clean national license utilization ratio.
  5. Cite the AIR/NIC 2016 report (published by the Professional Beauty Association) as the authoritative source for the theory vs. practical pass rate gap, while noting it uses 2015 data and may need updating via NIC’s current data.

Section 5: Key Sources and Citations

SourceRelevanceStrength
Utah OPLR Cosmetology Report, Jan 2025[^7]License utilization (32% work 0 hrs, 72% ≤20 hrs)Primary, survey-based
AIR/PBA Cosmetology Licensing Issues Report, 2016[^14]NIC theory vs. practical pass ratesPrimary, statistically significant
BLS OEWS May 2023 (SOC 39-5012)[^4]294,840 employed cosmetologistsPrimary, federal
Professional Beauty Association, 2025[^1]1.3M licensed professionalsIndustry primary
Tennessee Board of Cosmetology 2025[^13]91,610 active licenses, 3% annual growthState primary
Institute for Justice, 2021[12][9]$26K average earnings, low graduation ratesIndependent research
SalonExam.com, 2026[17][18]NIC exam domain analysis, failure causesIndustry secondary
Mississippi Board of Cosmetology, 2026[^19]Eliminated practical examState policy
California Board of Barbering and Cosmetology[15][20][^16]State pass rate data by school and yearState primary

Conclusion

Both claims are directionally supported by available evidence, with the following nuances:

Claim A (Less than 40% actively using their license): The most direct evidence comes from Utah’s OPLR survey, which found only 17% of active licensees work full-time (30+ hours), with 32% working zero hours. National comparisons of total licensed professionals (~1.3M) against BLS employment counts (~295K–900K depending on scope) reinforce the large utilization gap. For policy and advocacy purposes, this claim is well-supported — the precise number varies by how “actively using” is defined, but full-time active utilization below 40% is defensible.

Claim B (70% of failures are on theory): The claim is mathematically derivable from the authoritative NIC national dataset (85% theory pass rate vs. 93.7% practical pass rate) and confirmed by state-level data patterns. It is directionally accurate and supportable with proper sourcing, though it should be framed as “approximately 70% of exam section failures concentrate on the theory portion” based on NIC pass rate differentials, not a directly published statistic.

Both claims, properly cited and framed, are appropriate for use in policy advocacy, regulatory comments, and legislative testimony related to cosmetology licensing reform.

References

  1. Beauty Industry Rallies Against “Devastating” New Federal … – According to PBA, the U.S. beauty industry is made up of more than 1.3 million licensed professional…
  2. May 12, 2025 The Honorable Jason Smith Chairman, … – The U.S. salon and spa industry is a vital contributor to the American economy and a gateway to entr…
  3. Economic Snapshot of the Salon Industry – More than 1.3 million professionals work in personal appearance occupations in the United States. In…
  4. Hairdressers, Hairstylists, and Cosmetologists – 75% 90% Hourly. The percentile wage estimate is the value of a wage below which a certain percent of…
  5. US Cosmetology Industry: Statistics and Market Overview – The BLS OEWS program reported approximately 670,000 workers employed as hairdressers, hairstylists, …
  6. Hairdressers, hairstylists, & cosmetologists – The workforce of Hairdressers, hairstylists, & cosmetologists in 2024 was 505,296 people, with 90.7%…
  7. OPLR Cosmetology Report – Utah Department of Commerce – There are currently 56,766 people with at least one active cosmetology license in the state, more th…
  8. Barbers, Hairstylists, and Cosmetologists – Overall employment of barbers, hairstylists, and cosmetologists is projected to grow 5 percent from …
  9. Cosmetology – On average, completing the required classes for a cosmetology license costs more than $16,000, accor…
  10. Licensure – Kentucky Board of Cosmetology – An inactive license can be renewed/restored provided the license has been expired for less than five…
  11. 20 CSR 2085-7.040 – Cosmetologist Renewal and Inactive … – (3) Inactive License-A cosmetologist may choose to place his/her license on an inactive status by si…
  12. New Report Uncovers the Shocking Student Debt Burden … – And in any given year, between 15% and 31% of cosmetology schools saw none of their students graduat…
  13. Tab 8 Public Chapter 102, Acts of 2025 (Cosmetology and … – licensing average 3% growth for total employment. As of July 2025, there were 91,610 active cosmetol…
  14. Examination of Cosmetology Licensing Issues – Across states, the average NIC pass rates are consistently higher for the practical section (M = 93….
  15. How To Find The Exam Pass Rate For Your School and State. – The Nationwide Exam Pass Rate for COSMETOLOGY is 55%. The nationwide Exam Pass Rate for BARBERS is 3…
  16. Concerning California Barber Exam Pass Rates Reveal … – California has reported a shockingly low barber exam pass rate of 30%. the average pass rate for App…
  17. Cosmetology Exam Pass Rates by State (2026 Data) – The national cosmetology exam pass rate averages 70-80%. See how pass rates differ by state, what fa…
  18. Is the Cosmetology Exam Hard? Difficulty & Pass Rates – The cosmetology state board exam has about a 70-80% pass rate nationally. Learn what makes the NIC/P…
  19. Weeks after Mississippi eliminated its hands-on licensing … – The New Board of Cosmetology and Barbering is re- establishing what it takes to be a licensed cosmet…
  20. Community College vs. Private Cosmetology School in LA … – 2025 California State Board cosmetology written exam pass rates: Beyond 21st Century Beauty Academy:…
  21. Congress exempted beauty schools from rules about how … – About 80% of those are for-profit programs, and 45 percent are cosmetology schools. … Number of gr…

Public Disclaimer / Educational Purpose Statement

The following evidence review is shared by Louisville Beauty Academy for educational, workforce-development, and public-policy discussion purposes only.

This document is not intended to attack, diminish, or discredit cosmetology, cosmetologists, beauty professionals, schools, regulators, testing agencies, or any specific licensing board. Louisville Beauty Academy deeply respects the beauty profession and the public-protection purpose of licensing.

The purpose of this review is to ask a constructive workforce question:

Is the modern beauty workforce still being treated as one single license pathway, when today’s industry includes many distinct career pathways — cosmetology, nail technology, esthetics, shampoo styling, eyelash services, instructor training, and more?

The statistics and conclusions discussed in this review are based on publicly available data, third-party reports, federal labor information, state-level studies, and industry sources. Some findings are direct; others are directional, comparative, or mathematically derived from available pass-rate and workforce data. Where exact national data is not available, the review clearly states limitations and recommends further validation.

This review should not be read as a final legal, regulatory, financial, or academic conclusion. It is a good-faith policy and workforce analysis intended to support better discussion around:

Student protection
Affordable education
Right-sized licensing
Workforce alignment
Exam readiness
Debt reduction
Public safety
Career-specific training pathways

Louisville Beauty Academy’s position is simple:

Licensing should protect the public. Education should protect the student. Workforce pathways should match real career use.

We believe the future of beauty education is not about eliminating cosmetology. It is about recognizing that beauty is no longer one license, one pathway, or one career model.

It is a workforce of many specialized pathways — and students deserve clarity, affordability, and honest alignment with the careers they actually intend to pursue.

This review is shared in that spirit.

Beauty Education as Economic Security in an AI-Disrupted Economy:Evidence from U.S. Workforce Data, Inflation Trends, and Postsecondary Regulation (2023–2026) – RESEARCH & PODCAST SERIES 2026


Disclaimer: This article is published on the website of Louisville Beauty Academy for informational and public educational purposes only. The research, analysis, and opinions presented herein were independently prepared by the research team at Di Tran University — The College of Humanization as part of its Research & Podcast Series. Louisville Beauty Academy does not interpret or provide legal, regulatory, or financial advice through this publication and does not represent any government agency or regulatory authority. All references to laws, regulations, economic data, and workforce statistics are based on publicly available sources and academic analysis and should not be relied upon as official guidance. Readers seeking legal, regulatory, or professional advice should consult qualified professionals or the appropriate government authorities.


Introduction: Regulatory Accountability and the Restructuring of Vocational Education

The regulatory landscape of U.S. postsecondary education underwent a structural transformation between 2023 and 2026, driven primarily by the reintroduction and expansion of the Department of Education’s “Gainful Employment” (GE) and “Financial Value Transparency” (FVT) frameworks. Finalized on October 10, 2023, these regulations established a comprehensive accountability system for programs authorized under Title IV of the Higher Education Act (HEA), specifically targeting non-degree programs at public and private non-profit institutions and all programs at for-profit (proprietary) institutions.1 The core objective of these rules is to ensure that career-focused education leads to measurable economic outcomes, defined by graduates’ ability to service their debt and earn more than a typical high school graduate.3

The GE framework utilizes two primary performance metrics: the debt-to-earnings (D/E) ratio and the earnings premium (EP) test. Under 34 CFR Part 668, a program is deemed to pass the D/E standard if its median annual debt service is less than or equal to 8% of median annual earnings or less than or equal to 20% of discretionary earnings.3 Discretionary earnings are calculated as median annual earnings minus 150% of the federal poverty guideline for a single individual, which was approximately $21,870 in 2023.3 The EP test requires that a program’s typical graduate earns at least as much as a typical high school graduate between the ages of 25 and 34 in the labor force for the corresponding state.2 Programs that fail the same metric for two out of three consecutive years lose their eligibility to participate in federal student aid programs.2

The implementation of these standards has exerted significant pressure on the for-profit vocational sector, particularly beauty and cosmetology schools. Historical evidence from the 2014 regulatory cycle serves as a precursor to contemporary trends; data indicate that approximately 32% of cosmetology certificate programs either failed or entered a “warning” zone under earlier iterations of these benchmarks.5 In the 2024–2025 period, the Department of Education utilized administrative data from the National Student Loan Data System (NSLDS) and the Internal Revenue Service (IRS) to generate “Completers Lists,” which established the cohorts for outcome measurement.6 Reporting obligations for all institutions became effective on July 1, 2024, and by early 2025, the Department began issuing the first GE and FVT scores.3

Data indicate that the threat of losing Title IV eligibility has accelerated the closure rate of low-performing institutions. Research on institutional characteristics shows that private for-profit colleges are approximately three times as likely to close as private non-profits, with for-profit two-year schools experiencing the highest closure rates in the postsecondary market.8 Between 1996 and 2023, nearly one-third of observed institutions in the two-year for-profit sector closed.8 Contemporary examples from 2024–2025 highlight this trend; for instance, a prominent beauty school chain in Tennessee faced loss of accreditation and closure after reporting an on-time graduation rate of only 3% and poor loan repayment outcomes.5 At the national level, federal data from February 2026 revealed that over 1,800 institutions exhibited nonpayment rates at or exceeding 25%, placing them at “serious risk” of failing future cohort default rate (CDR) and GE benchmarks.9

Regulatory Timeline for GE and FVT ImplementationKey Action Item
October 10, 2023Publication of Final Rule (88 FR 70004) 2
July 1, 2024Effective date for reporting and administrative capability 2
January 15, 2025Deadline for institutional reporting of student-level data 6
Early 2025Issuance of first GE/FVT scores and metrics 3
July 1, 2026Launch of public program information website and student acknowledgment requirements 2

The regulatory environment of 2026 is further defined by the Financial Value Transparency provisions, which require all Title IV-eligible programs to disclose comprehensive costs, median debt, and median earnings on a public-facing website.2 Starting July 1, 2026, students must provide a formal acknowledgment that they have viewed this information before enrolling in programs with failing D/E rates.2 This “transparency-as-accountability” model assumes that informed consumer choice will drive enrollment away from programs that “leave students no better off” than those with only a high school diploma.5

Macroeconomic Context: Inflationary Volatility and Geopolitical Shocks

The macroeconomic climate of early 2026 is characterized by a confluence of persistent domestic inflation and acute geopolitical instability in the Middle East, both of which have introduced significant volatility into the U.S. economy. As of February 2026, the Bureau of Labor Statistics (BLS) reported that the Consumer Price Index for All Urban Consumers (CPI-U) increased by 0.3% on a seasonally adjusted basis, with a 12-month unadjusted increase of 2.4%.10 While the 12-month headline inflation rate matched the previous month’s reading, internal components, particularly energy and food, showed signs of acceleration.10

The food index rose 0.4% in February 2026, with the index for food at home also increasing by 0.4%.10 Over the previous 12 months, food prices increased by 3.1%, driven by a 5.6% rise in nonalcoholic beverages and a 3.9% increase in food away from home.10 These increases have been compounded by a resurgence in energy costs. The energy index increased 0.6% in February 2026, reversing a 1.5% decline in January.10 Natural gas prices surged 10.9% over the 12 months ending in February, while electricity prices rose 4.8%.10

Consumer Price Index ComponentMonthly Change (Feb 2026)12-Month Change (Feb 2026)
All Items+0.3%+2.4%
Food at Home+0.4%+2.4%
Food Away from Home+0.3%+3.9%
Energy+0.6%+0.5%
Utility (piped) Gas+3.1%+10.9%
Electricity-0.7%+4.8%
Shelter+0.2%+3.0%
Personal Care-0.2%+4.5%
Source: 10

The primary driver of energy volatility in 2026 has been the escalation of military conflict in the Middle East, specifically involving the Strait of Hormuz. Following joint U.S. and Israeli airstrikes on Iran on February 28, 2026, Iran effectively halted maritime traffic through the strait, a critical chokepoint through which approximately 20 million barrels of crude oil and oil products pass daily.13 This disruption removed roughly one-fifth of the world’s oil and gas supply from the market, causing an immediate spike in global energy prices.14 Brent crude oil surged from $70 per barrel to over $110 per barrel within days of the conflict’s commencement.16 By March 6, 2026, Brent was trading at $92 per barrel, up 28% from the previous week’s close.17

In the United States, gasoline prices responded to these global trends, rising by 0.8% in February and surging by double-digit percentages in early March.12 Analysts from the International Energy Agency (IEA) noted that commercial traffic through the Persian Gulf had slowed “to a trickle” as insurers and shipowners reassessed the risks.13 This geopolitical friction has broader economic implications, with the OECD projecting that global growth will moderate to 3.0% in 2026 as higher trade barriers and policy uncertainty dampen investment.18 In the U.S., GDP growth is projected to slow to 1.6% in 2026, down from 2.2% in 2025.18

Furthermore, the transition to an AI-influenced economy has introduced a new layer of workforce disruption. Research from the McKinsey Global Institute suggests that by 2030, approximately 14% of employees globally—and 375 million workers total—will require significant reskilling due to automation and digitization.19 Estimates indicate that up to 30% of current work hours in the U.S. could be automated by 2030, with a focus on routine tasks in data entry, manufacturing, and customer service.19 The World Economic Forum projects that 85 million jobs may be displaced by AI by 2025, although this will likely be offset by the creation of 97 million new roles, particularly those requiring “human-centric” skills.20

Recession-Resilience and Economic Elasticity of Beauty Trades

The beauty and personal care industry has demonstrated a historical capacity for recession-resilience, often quantified through the “Lipstick Effect”—an economic phenomenon where consumers continue to purchase small, affordable luxury items during financial downturns even as they curtail larger discretionary expenditures.22 Data from the 2008 financial crisis indicate that industry spending fell only slightly and returned to pre-recession levels by 2010.24 During the Great Recession of 2007–2009, cosmetic purchases among married women increased by 9.8%, and the average annual expenditure on beauty products rose from $139 in 2007 to $152 in 2009.23

The 2020 COVID-19 pandemic provided a more severe test of elasticity, as government-mandated lockdowns forced the closure of physical service locations. During this period, global beauty industry revenues fell by 20% to 30%, with professional services being the hardest hit.24 However, the sector exhibited a rapid rebound; by 2021, lipstick sales increased by 80% once mask mandates were lifted, and consumers shifted toward self-care and skincare categories during the isolation period.23 This suggests that while beauty services are physically constrained by lockdowns, the underlying demand for personal grooming remains highly inelastic.

In the current 2024–2026 economic environment, BLS wage data highlight the relative stability of beauty trades. As of May 2024, the median annual pay for barbers, hairstylists, and cosmetologists was $35,420.26 While this is below the median for all occupations ($23.80 per hour), the sector offers a robust path to self-employment, which acts as a hedge against corporate downsizing. In 2024, 76% of barbers were self-employed.26 This high rate of independent operation allows practitioners to adjust their prices more dynamically in response to localized inflation (e.g., rising shelter and utility costs) than fixed-salary employees.26

Occupational Title (SOC)Employment (2024)Median Hourly Wage (2024)Projected Growth (2024–34)
Barbers (39-5011)76,000$18.734%
Hairdressers/Cosmetologists (39-5012)575,200$16.956%
Skincare Specialists (39-5094)100,000*$19.98*9%*
Manicurists/Pedicurists (39-5092)170,000*$16.66*8%*
Source: 26 (*Estimated based on 2024 summaries)

The “humanization of labor” in the beauty industry creates a unique economic sanctuary. Evidence from high-performing salon owners suggests that established facilities with 10–20 technicians can generate annual gross revenues between $1 million and $2.4 million.27 Unlike the corporate sector, which is increasingly threatened by AI-driven efficiency gains, the beauty service industry is “inventory-light” and centered on the “physics of touch,” which limits the potential for remote or automated displacement.24 The 2024–2026 period has seen a “human premium” emerge, where skills related to empathy, creativity, and fine motor skills command stable demand despite broader macroeconomic volatility.21

Affordability, Debt Traps, and the Divergent Models of Beauty Education

The financial structure of beauty education has historically been a significant point of concern for federal regulators. Research from New America and the National Association of Student Financial Aid Administrators (NASFAA) found that for-profit beauty schools often carry high tuition premiums linked to Title IV eligibility.31 Average student debt for cosmetology graduates typically ranges from $7,000 to $11,000, which can represent a substantial portion of an entry-level practitioner’s annual earnings.32

Evidence indicates a sharp disparity in tuition between Title IV-participating programs and cash-based models. Title IV cosmetology programs often charge between $15,000 and $20,000, whereas non-Title IV programs (often referred to as lower-debt or cash-based models) frequently offer the same licensure hours for $4,000 to $8,000.32 This “tuition premium” in the Title IV sector is often offset by Pell Grants and federal loans, yet it frequently leads to higher default rates if the graduates fail to secure immediate, high-paying work.5

The implementation of the “One Big Beautiful Bill Act” (OBBBA) in 2026 introduced new constraints on this model. The OBBBA established firm annual and lifetime caps on federal student loans, replacing the previous system where the “Cost of Attendance” (COA) was the primary limit.35 Under the OBBBA, independent undergraduates face an annual loan limit of $9,500–$12,500, which may leave many students at high-tuition for-profit schools with a significant funding gap.36 Furthermore, the elimination of the Grad PLUS loan program has placed additional revenue pressure on institutions that depend on debt-financed graduate or professional certificates.35

Loan Category (OBBBA 2026)Annual LimitLifetime Aggregate Limit
Independent Undergraduate$9,500 – $12,500$57,500
Dependent Undergraduate$5,500 – $7,500$31,000
Parent PLUS (Per Student)$20,000$65,000
Graduate Students$20,500$100,000
Source: 36

As Title IV-dependent schools face higher compliance costs and lower borrowing caps, “cash-pay” models have become more prominent. These institutions typically utilize “pay-as-you-go” plans and institutional scholarships (which can cover 50% to 75% of tuition) to maintain affordability without federal oversight.33 Data from 2025 show that students graduating from these lower-debt models enter the workforce with written payment-bearing debt, significantly improving their Debt-to-Earnings ratios compared to their peers at traditional for-profit institutions.32 Default rates at beauty schools that relied heavily on Title IV aid reached alarming levels in early 2026; over 500 cosmetology schools were flagged by the Department of Education as having 30% or more of their borrowers more than 90 days delinquent.31

Workforce Security: Automation Resistance and Multilingual Integration

The beauty industry is uniquely positioned to resist the automation risks identified by Oxford Economics and McKinsey. While Oxford Economics reports that approximately 47% of U.S. jobs are “at risk” of computerization over the next two decades, these risks are heavily concentrated in logistics, administrative support, and routine production labor.39 Personal care services, including barbers and cosmetologists, are classified as “low risk” due to the high degree of manual dexterity, social intelligence, and creativity required to perform non-routine tasks in unstructured environments.39

The McKinsey Skill Change Index (SCI) confirms this trend, showing that “assisting and caring” skills will experience the least change in demand due to AI through 2030.21 While AI tools are being integrated into the industry for scheduling, virtual try-on, and business management, the core service—the physical manipulation of hair, skin, and nails—remains a “humanized” endeavor.27 This resistance to automation is a critical component of workforce security in an environment where 18.4 million experienced workers are expected to retire by 2032, creating a “skills shortage” in occupations that require postsecondary credentials and tangible service skills.42

Workforce Factor (2024–2026)Beauty/Personal Care Industry Status
Automation VulnerabilityLow (Non-routine physical tasks) 39
Human Skills PremiumHigh (Social intelligence, empathy) 21
Credential AlignmentState Licensure required (Protective barrier) 27
Demographic Support79.3% Female workforce; 33% POC 43
Multilingual AvailabilitySpanish, Vietnamese, Korean, Chinese 44

Workforce accessibility has also been enhanced through the expansion of multilingual licensing pathways. In states like California, Florida, and Texas, cosmetology licensing boards offer exams in multiple languages to accommodate the diverse demographic profile of the industry.32 For example, the California Board of Barbering and Cosmetology offers its laws and regulations book in Korean, Spanish, Vietnamese, and Simplified Chinese.44 Data from previous years indicated that Spanish test-takers achieved an 82% pass rate on the practical portion of the examination, which is conducted in English but allows for visual following.45 In Florida, the Board of Cosmetology regulates and approves products for infection control and sets rules for practitioners who must maintain a 75% passing mark for licensure.45

The Georgetown Center on Education and the Workforce (CEW) notes that institutions offering certificates and associate degrees often provide a higher return on investment (ROI) after 10 years than institutions offering bachelor’s degrees, as they allow students to enter the workforce faster with lower out-of-pocket costs.48 For early-career workers, certificates in middle-skills occupations can lead to median annual earnings of $83,300 by mid-career.48 In the beauty sector, this rapid entry is facilitated by programs that streamline training to state-minimum hours (e.g., 1,500 hours for cosmetology, 600–750 for esthetics, 300–450 for nail technology).32

Case Study: Analysis of an Outcomes-Based Vocational Institution

The shifting paradigm of postsecondary education is exemplified by a specific, anonymously profiled institution that has expanded its footprint during a period of widespread sector consolidation. This family-owned academy, located in the Southeastern United States, operates a model that intentionally decouples vocational training from federal student debt, focusing instead on “cash-pay” affordability and labor market placement.38

Operational and Financial Metrics

Unlike traditional Title IV-dependent schools, this institution does not participate in federal student loan programs. Instead, it utilizes an “innovative pay-as-you-go” tuition plan and provides institutional scholarships that cover up to 50–75% of the total cost.33 This results in a tuition structure that is 50–80% lower than prevailing market rates. For example, the institution’s Nail Technology course is priced at approximately $3,800 (after aid), whereas regional competitors charge $15,000 to $20,000 for the same certification.33

Institution Performance MetricReported ValueIndustry Benchmark
On-time Completion Rate~90%24% – 31%
Job Placement Rate~90%~70%
Student Loan Debt upon Graduation$0$7,000 – $11,000
Nail Technology Tuition$3,800$15,000+
Real Estate Ownership Status100% Owned (Main/West)Variable (Leased typical)
Source: 33

The institution’s facility model is anchored in real estate ownership, with its main and west campuses fully licensed and operating through July 31, 2026.38 This strategy of owning the underlying assets allows the institution to keep operating costs low and provides insulation from the inflationary shocks currently impacting commercial rent in the region.27

Workforce Integration and Recognition

The academy focuses on serving underrepresented communities, including immigrants and low-income individuals, through multilingual instruction and state-board-aligned curricula.33 Graduates of the 6-month nail technology program or the 1,500-hour cosmetology program secure jobs or start salon businesses at a rate of 90%, collectively contributing an estimated $20 million to $50 million annually to the local economy.33

In 2025, the institution achieved historic national recognition, becoming the first beauty academy to be honored simultaneously as a U.S. Chamber of Commerce CO—100 Award winner and a National Small Business Association (NSBA) “Advocate of the Year” finalist.33 These accolades were awarded based on the institution’s workforce development outcomes and its role as a model for “ethical, outcomes-driven training”.33 Furthermore, the institution has expanded its curriculum to include fast-growing specialties such as eyelash extensions (16–320 hours depending on state law) to meet the evolving demands of the “Gen Z aesthetic” market.30

The case study institution—identified in public filings as the Louisville Beauty Academy—demonstrates that high graduation rates and low student debt are achievable when institutional priorities are aligned with labor market demand rather than the maximization of Title IV drawdowns.33 By prioritizing biometric attendance tracking for hour integrity and maintaining a “Success Sharing” discount model for students, the academy has created a replicable template for vocational education in a post-federal-aid world.32

Policy Implications

The data from the 2023–2026 period suggest that the traditional for-profit education model, characterized by high-tuition premiums and heavy reliance on federal debt, is increasingly unsustainable under new gainful employment benchmarks and shifting macroeconomic conditions. Real-estate-owned, lower-debt vocational models provide a stable alternative by reducing the “tuition premium” associated with Title IV eligibility and insulating students from the long-term debt traps that currently define the sector. By prioritizing low-cost, cash-based education and multilingual licensure, these models not only satisfy the Department of Education’s financial value transparency requirements but also provide a resilient pathway to economic security in an environment disrupted by AI, energy-driven inflation, and geopolitical volatility.

Works cited

  1. Financial Value Transparency and Gainful Employment Information | Knowledge Center, accessed March 13, 2026, https://fsapartners.ed.gov/knowledge-center/topics/financial-value-transparency-and-gainful-employment-information
  2. Regulatory Requirements for Financial Value Transparency and …, accessed March 13, 2026, https://fsapartners.ed.gov/knowledge-center/library/dear-colleague-letters/2024-03-29/regulatory-requirements-financial-value-transparency-and-gainful-employment-updated-sept-16-2024
  3. New Gainful Employment Rules Impact For-Profit and Nonprofit Colleges and Universities, accessed March 13, 2026, https://www.hklaw.com/en/insights/publications/2023/10/new-gainful-employment-rules-impact-for-profit-and-nonprofit
  4. Draft Memo on DTE for AHEAD (Submitted by Tamar Hoffman) – Department of Education, accessed March 13, 2026, https://www.ed.gov/media/document/2025-ahead-draft-memo-dte-ahead-submitted-tamar-hoffman-112941.pdf
  5. Gainful Employment Rules and School Closures (2014–Present) – MAY 2025 STUDY, accessed March 13, 2026, https://naba4u.org/2025/05/gainful-employment-rules-and-school-closures-2014-present-may-2025-study/
  6. (GE-24-10) Reminder of Institutional Requirements for Financial Value Transparency & Gainful Employment that Must Be Completed by January 15, 2025, accessed March 13, 2026, https://fsapartners.ed.gov/knowledge-center/library/electronic-announcements/2024-11-13/reminder-institutional-requirements-financial-value-transparency-gainful-employment-must-be-completed-january-15-2025
  7. Gainful Employment Redux – Not Just for For-Profits Anymore – CooleyED, accessed March 13, 2026, https://ed.cooley.com/2023/10/26/gainful-employment-redux-not-just-for-for-profits-anymore/
  8. Colleges Are Closing. Who Might Be Next?, accessed March 13, 2026, https://www.educationnext.org/colleges-are-closing-who-might-be-next-how-machine-learning-fill-data-gaps-forecast-future/
  9. ED Releases Updated Data on Nonpayment Rates by Institution, Warns of High Cohort Default Rates – nasfaa, accessed March 13, 2026, https://www.nasfaa.org/news-item/38256/ED_Releases_Updated_Data_on_Nonpayment_Rates_by_Institution_Warns_of_High_Cohort_Default_Rates
  10. Consumer Price Index – February 2026 – BLS.gov, accessed March 13, 2026, https://www.bls.gov/news.release/pdf/cpi.pdf
  11. Bureau of Labor Statistics, accessed March 13, 2026, https://www.bls.gov/
  12. US consumer inflation steady before Iran conflict drives up oil prices – Virginia Business, accessed March 13, 2026, http://virginiabusiness.com/us-consumer-prices-february-iran-conflict-oil/
  13. The global price tag of war in the Middle East, accessed March 13, 2026, https://www.weforum.org/stories/2026/03/the-global-price-tag-of-war-in-the-middle-east/
  14. How Iran Blocking the Strait of Hormuz Affects the U.S., accessed March 13, 2026, https://www.factcheck.org/2026/03/how-iran-blocking-the-strait-of-hormuz-affects-the-u-s/
  15. The War in Iran Will Raise Fuel Prices and Costs Throughout the Economy, accessed March 13, 2026, https://www.americanprogress.org/article/the-war-in-iran-will-raise-fuel-prices-and-costs-throughout-the-economy/
  16. Economic impact of the 2026 Iran war – Wikipedia, accessed March 13, 2026, https://en.wikipedia.org/wiki/Economic_impact_of_the_2026_Iran_war
  17. What Does the Iran War Mean for Global Energy Markets?, accessed March 13, 2026, https://www.csis.org/analysis/what-does-iran-war-mean-global-energy-markets
  18. OECD Economic Outlook, Interim Report March 2025 | OECD, accessed March 13, 2026, https://www.oecd.org/en/publications/oecd-economic-outlook-interim-report-march-2025_89af4857-en.html
  19. Which jobs can remain secure until 2030 despite AI? – AEEN, accessed March 13, 2026, https://www.aeen.org/which-jobs-can-remain-secure-until-2030-despite-ai/
  20. How Many Jobs Will AI Replace & How to Adapt [2025 – 2030] – Jobright, accessed March 13, 2026, https://jobright.ai/blog/how-many-jobs-will-ai-replace/
  21. Agents, robots, and us: Skill partnerships in the age of AI – McKinsey, accessed March 13, 2026, https://www.mckinsey.com/mgi/our-research/agents-robots-and-us-skill-partnerships-in-the-age-of-ai
  22. The Economics of Beauty: How the Beauty Industry Thrives in Changing Markets – IJFMR, accessed March 13, 2026, https://www.ijfmr.com/papers/2025/2/39953.pdf
  23. The Lipstick Index: Why Beauty Stays Resilient Through Economic Downturns, accessed March 13, 2026, https://soshebeauty.com/blogs/thesosheedit/the-lipstick-index-why-beauty-stays-resilient-through-economic-downturns
  24. How COVID-19 is changing the world of beauty – McKinsey, accessed March 13, 2026, https://www.mckinsey.com/~/media/McKinsey/Industries/Consumer%20Packaged%20Goods/Our%20Insights/How%20COVID%2019%20is%20changing%20the%20world%20of%20beauty/How-Covid-19-is-changing-the-world-of-beauty-vF.pdf
  25. Impact of Covid-19 on Beauty & Wellness – Baird, accessed March 13, 2026, https://content.rwbaird.com/RWB/sectors/PDF/consumer/Impact-of-Covid-19-on-Beauty-Wellness.pdf
  26. Barbers, Hairstylists, and Cosmetologists : Occupational Outlook Handbook – BLS.gov, accessed March 13, 2026, https://www.bls.gov/ooh/personal-care-and-service/barbers-hairstylists-and-cosmetologists.htm
  27. AI proof jobs beauty Archives – Louisville Beauty Academy, accessed March 13, 2026, https://louisvillebeautyacademy.net/tag/ai-proof-jobs-beauty/
  28. Hairdressers, Hairstylists, and Cosmetologists – Bureau of Labor Statistics, accessed March 13, 2026, https://www.bls.gov/oes/2023/may/oes395012.htm
  29. Barbers – BLS.gov, accessed March 13, 2026, https://www.bls.gov/oes/2023/may/oes395011.htm
  30. Tag: workforce transformation 2026 – Louisville Beauty Academy, accessed March 13, 2026, https://louisvillebeautyacademy.net/tag/workforce-transformation-2026/
  31. Should Failing Beauty Schools Keep Access to Federal Aid? New …, accessed March 13, 2026, https://www.newamerica.org/insights/should-failing-beauty-schools-keep-access-to-federal-aid-new-data-suggests-no/
  32. beauty education regulation 2026 Archives – Louisville Beauty Academy, accessed March 13, 2026, https://louisvillebeautyacademy.net/tag/beauty-education-regulation-2026/
  33. Outcomes-Based Beauty Education : A Workforce and Policy …, accessed March 13, 2026, https://naba4u.org/2025/12/outcomes-based-beauty-education-a-workforce-and-policy-analysis-of-lower-debt-completion-driven-vocational-models-research-december-2025/
  34. nail school Louisville KY Archives, accessed March 13, 2026, https://louisvillebeautyacademy.net/tag/nail-school-louisville-ky/
  35. Effect of Changes to Title IV of the Higher Education Act in the One Big Beautiful Bill, accessed March 13, 2026, https://www.ropesgray.com/en/insights/alerts/2025/08/effect-of-changes-to-title-iv-of-the-higher-education-act-in-the-one-big-beautiful-bill
  36. One Big Beautiful Bill Act education Archives – Louisville Beauty Academy, accessed March 13, 2026, https://louisvillebeautyacademy.net/tag/one-big-beautiful-bill-act-education/
  37. Louisville Beauty Academy & Founder Di Tran: Elevating Beauty Education and Small Business Advocacy to the National Level – National Small Business Association (NSBA), Washington, D.C. – SEPTEMBER 2025, accessed March 13, 2026, https://louisvillebeautyacademy.net/louisville-beauty-academy-founder-di-tran-elevating-beauty-education-and-small-business-advocacy-to-the-national-level-national-small-business-association-nsba-washington-d-c-s/
  38. About Us – Louisville Beauty Academy – Louisville KY, accessed March 13, 2026, https://louisvillebeautyacademy.net/about/
  39. Oxford Study: 47% of U.S. Jobs Could Be Done by Machines, accessed March 13, 2026, https://www.mddionline.com/automation/oxford-study-47-of-u-s-jobs-could-be-done-by-machines
  40. Recognizing the Risks of Job Automation in 2023 – HRTech Series, accessed March 13, 2026, https://techrseries.com/hrtechnology/recognizing-the-risks-of-job-automation-in-2023/
  41. Four Futures for Jobs in the New Economy: AI and Talent in 2030 – World Economic Forum publications, accessed March 13, 2026, https://reports.weforum.org/docs/WEF_Four_Futures_for_Jobs_in_the_New_Economy_AI_and_Talent_in_2030_2025.pdf
  42. Falling Behind: How Skills Shortages Threaten Future Jobs – CEW Georgetown, accessed March 13, 2026, https://cew.georgetown.edu/cew-reports/skills-shortages/
  43. Economic And Social Impact – Personal Care Products Council, accessed March 13, 2026, https://www.personalcarecouncil.org/about/economic-and-social-impact/
  44. Laws and Regulations – California Board of Barbering and Cosmetology – CA.gov, accessed March 13, 2026, https://www.barbercosmo.ca.gov/laws_regs/index.shtml
  45. Free Cosmetology Practice Test (2026) | Questions & Answers – iPREP, accessed March 13, 2026, https://www.iprep.online/courses/cosmetology-practice-test/
  46. Review of the Low Pass Rate of Spanish Written Examinations – California Board of Barbering and Cosmetology, accessed March 13, 2026, https://www.barbercosmo.ca.gov/about_us/meetings/materials/20190122_sp.pdf
  47. FLORIDA STATE BOARD COSMETOLOGY EXAM 2024/2025 | Exams Nursing – Docsity, accessed March 13, 2026, https://www.docsity.com/en/docs/florida-state-board-cosmetology-exam-20242025/11903175/
  48. CEW’s Year in Review: 2025, accessed March 13, 2026, https://cew.georgetown.edu/resource/cew-2025-blog-year-in-review/
  49. LOUISVILLE BEAUTY ACADEMY ACHIEVES HISTORIC DUAL NATIONAL RECOGNITION: FIRST KENTUCKY BUSINESS TO SECURE TWO PRESTIGIOUS AWARDS IN A SINGLE YEAR, accessed March 13, 2026, https://louisvillebeautyacademy.net/louisville-beauty-academy-achieves-historic-dual-national-recognition-first-kentucky-business-to-secure-two-prestigious-awards-in-a-single-year/
  50. Why the Future of Education Is Cash-Based—and Louisville Beauty Academy Is Leading the Nation – March 2025, accessed March 13, 2026, https://naba4u.org/2025/03/why-the-future-of-education-is-cash-based-and-louisville-beauty-academy-is-leading-the-nation-march-2025/