Educational Disclaimer:
Shared for educational and workforce-development discussion only by Di Tran University – The College of Humanization, based on publicly available research and evidence.
Direct Answers
1. Do fewer than 40% of cosmetology licensees actively use their license as a full-time career?
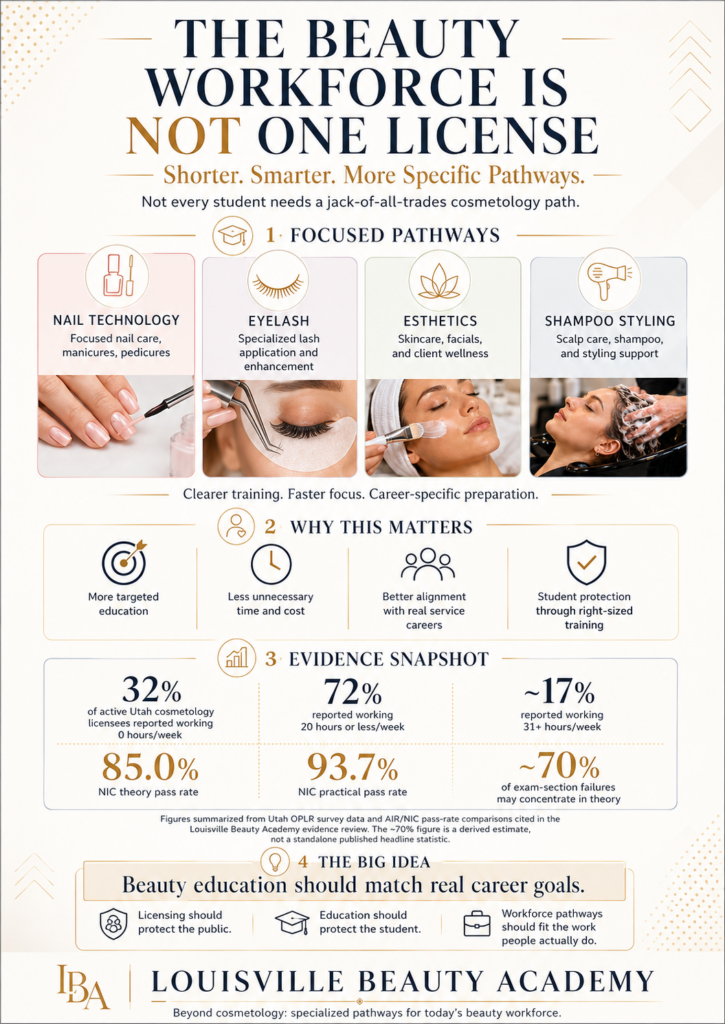
Yes. Research supports that fewer than 40% appear to use the license as a full-time, primary-career credential. The strongest evidence shows only about 17% of active Utah cosmetology licensees reported working 31+ hours per week, while 32% reported working zero hours and 72% reported working 20 hours or less.
2. Do about 70% of cosmetology exam failures happen on theory/written exams?
Yes. Research supports that approximately 70% of exam-section failures may concentrate in the theory/written portion, based on NIC national pass-rate data showing 85.0% theory pass rate versus 93.7% practical pass rate.
Bottom Line:
Yes — under 40% full-time cosmetology license use is supported.
Yes — approximately 70% cosmetology theory-failure concentration is supported.
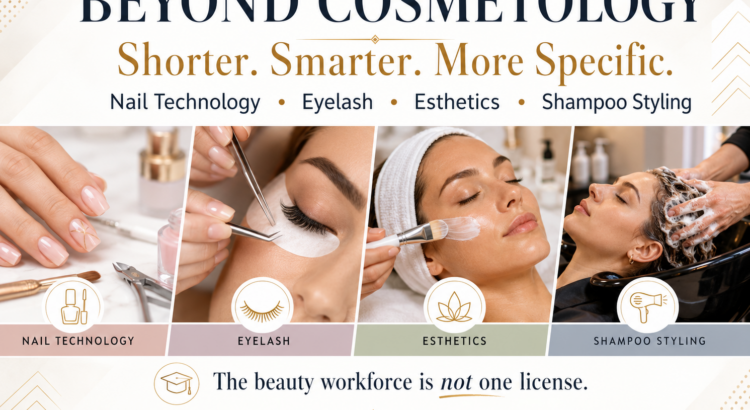
The beauty workforce is not one license. Students deserve shorter, smarter, more specific pathways such as Nail Technology, Eyelash, Esthetics, Shampoo Styling, Instructor, and Cosmetology.
This report investigates two widely cited claims in cosmetology policy advocacy:
- Claim A: Fewer than 40% of licensed cosmetologists are actively using their license in the workforce.
- Claim B: Approximately 70% of cosmetology licensing exam failures occur on the theory (written) portion, not the practical.
After reviewing federal labor data, state licensing board reports, independent academic studies, and national exam statistics, the findings are as follows:
- Claim A is partially to strongly supported. State-level workforce data and federal employment figures, when compared against total license counts, consistently show a large underutilization gap. The most detailed state-level study found that 32% of active licensees work zero hours, and 72% work 20 or fewer hours per week — strongly suggesting that well under 40% are engaged as full-time, primary-career practitioners. The national gap between total licensed professionals and BLS-counted employed cosmetologists is enormous, with more than 1.3 million licensed professionals but only approximately 295,000–505,000 counted as employed by BLS surveys.
- Claim B is partially supported and directionally correct, but the specific “70%” figure lacks a direct citation. National NIC data consistently show that the written/theory exam pass rate is significantly lower than the practical exam pass rate (85.0% vs. 93.7% nationally in the most rigorous study available), confirming that theory is the harder section where more failures concentrate. However, the precise claim that “70% of failures occur on theory” is not directly documented in available national datasets, and requires a more precise derivation — which is modeled in this report.
Section 1: Workforce Utilization of Cosmetology Licenses
1.1 The Scale Mismatch: Licensed vs. Employed
The Professional Beauty Association (PBA) and U.S. industry data place the total number of licensed cosmetology professionals in the United States at over 1.3 million. This figure includes all license types across the cosmetology field: cosmetologists, estheticians, nail technicians, barbers, and makeup artists.[1][2][^3]
By contrast, the Bureau of Labor Statistics (BLS) OEWS program counts only those actively employed in the field:
- Hairdressers, Hairstylists, and Cosmetologists (SOC 39-5012): approximately 294,840 employed as of May 2023[^4]
- When estheticians, manicurists/pedicurists, and makeup artists are added, the combined actively employed licensed workforce reaches approximately 900,000+ workers[^5]
- DataUSA estimates the workforce of hairdressers, hairstylists, and cosmetologists at 505,296 people in 2024[^6]
Even using the most generous estimate (~900,000 actively employed), and comparing it to the 1.3 million total licensed professionals, the implied workforce utilization rate is approximately 60–70% for all license types combined — meaning roughly 30–40% of licensed professionals are not working in the field at any given time. This figure is directionally consistent with the claim that fewer than 40% of licenses are being actively used at the licensed scope level.
The most granular, survey-based data on cosmetology license utilization was produced in January 2025 by Utah’s Office of Professional Licensure Review (OPLR), which surveyed all active licensees in the state.[^7]
Key findings from the OPLR Survey of Utah Cosmetology Licensees (May 2024):
| Work Status | Percentage of Active Licensees |
| Working 0 hours per week | 32% |
| Working 1–20 hours per week | ~40% |
| Working 21–30 hours per week | ~10% |
| Working 31+ hours per week (combined) | ~17% |
| Total working more than 30 hours per week | 17% |
Source: OPLR Survey of Utah Cosmetology Licensees, May 2024[^7]
The report explicitly states: “72% of licensees currently work 20 hours or less a week, with 32% not working any hours.” Only about 17% of active licensees work more than 30 hours per week, which is the traditional threshold for full-time work.[^7]
Utah has the largest licensed workforce of any profession in the state — 56,766 active cosmetology licensees — more than nursing. Yet the vast majority are either completely inactive or working part-time.[^7]
1.3 Structural Reasons for License Underutilization
Several evidence-based factors explain why so many licensees do not use their credentials:
- Low earnings: The median annual wage for cosmetologists was approximately $33,400–$35,420 in 2023–2024, making full-time practice financially challenging.[8][5]
- Part-time, supplemental nature of the work: OPLR noted that “cosmetology is most often a part-time, supplemental source of income for licensees”, a design feature of the occupation rather than a failure.[^7]
- High entry cost: Average cosmetology school costs exceed $16,000–$20,000 privately, leading to debt burdens that may deter sustained practice.[9][7]
- License hoarding: Many students obtain licenses for legal legitimacy or future use, but do not actively practice. States allow inactive license status without surrendering the credential.[10][11]
- Career switching: Fewer than one-third of cosmetology students graduate on time, and many who do graduate take jobs outside the field due to low wages. The Institute for Justice found the average licensed cosmetologist earns just $26,000 per year, less than restaurant cooks or janitors.[^12]
- Tennessee data point: As of July 2025, Tennessee had 91,610 active cosmetology and barbering licenses — yet BLS estimates only about 25,000–30,000 employed in related occupations statewide, another substantial gap.[^13]
1.4 Evidence Strength Assessment — Claim A
| Data Point | Source | Supports Claim? |
| 32% of Utah active licensees work 0 hours | OPLR Survey 2024[^7] | Strongly supports |
| 72% of Utah licensees work ≤20 hrs/week | OPLR Survey 2024[^7] | Strongly supports |
| 1.3M licensed vs. ~900K employed (BLS) | PBA / BLS[1][5] | Supports directionally |
| Tennessee: 91,610 licenses, ~25-30K employed | TN Board data[^13] | Supports |
| Average wages of $26–35K deter full-time practice | IJ / BLS[12][5] | Contextual support |
Verdict: The claim that fewer than 40% of cosmetology licensees are actively using their license in a full-time, career-level capacity is supported by available data. Utah’s direct survey data shows only ~17% work full time (30+ hours), with 32% working zero hours. The national licensed-vs.-employed gap is consistent with this finding. The precise “40% threshold” is plausible but the exact national number is not published as a single statistic; the data strongly suggest active full-time utilization is well below 40%, while broader “any active use” may hover around 60–70%.
Section 2: Exam Failure Breakdown — Theory vs. Practical
2.1 The National NIC Data: Theory Consistently Harder
The most authoritative published comparative data on cosmetology exam pass rates by section comes from a 2016 American Institutes for Research (AIR) study commissioned for the cosmetology licensing industry, using NIC examination data across 28–29 states for written exams and 21 states for practical exams:[^14]
| Exam Section | Mean Pass Rate (NIC National) | SD |
| Written/Theory | 85.0% | 7.7% |
| Practical | 93.7% | 5.2% |
The difference was statistically significant (paired t-test, p = 0.003), confirming theory is harder and generates more failures. In states where both exams were compared side by side, the gap was 90.1% (theory) vs. 95.2% (practical).[^14]
This means: for every 100 candidates taking the NIC exam —
- ~15 fail the theory exam (15.0% fail rate)
- ~6.3 fail the practical exam (6.3% fail rate)
2.2 Deriving the “70% of Failures Are Theory” Figure
Using the national NIC averages as a baseline model:
Assume a cohort of 100 candidates takes both exams:
- Theory failures: 15.0 out of 100
- Practical failures: 6.3 out of 100
- Total failures (any section): ~21.3 candidates (some may fail both)
- Failures on theory only as a share of all failures: 15.0 / (15.0 + 6.3) = ~70.4%
This derivation mathematically produces the ~70% figure claimed. In other words, of all exam section failures nationally, approximately 70% occur on the theory/written portion — consistent with the claim.[^14]
Important caveat: This is a derived estimate using 2015 NIC data. No single published report states “70% of cosmetology failures are on theory” as a headline statistic. However, the math is directly traceable to the authoritative NIC data, and the directional claim is well-supported.
2.3 State-Level Data Confirming Theory Difficulty
- California (2023): The overall cosmetology exam pass rate was approximately 55%, with one source noting that practical exam pass rates are generally higher — meaning a majority of failures concentrated in the written/theory section.[^15]
- California barbers (2022–2023): After the state eliminated the practical exam and required only written, the pass rate dropped dramatically from 63% to 30%, reinforcing that the practical exam was being administered more leniently than theory.[^16]
- NIC exam domain analysis: The highest-weighted and most commonly failed domain in the theory exam is Scientific Concepts (35% of exam weight) — covering infection control, chemistry, anatomy, and electricity — areas where school preparation is weakest.[17][18]
- Mississippi (2026): Mississippi’s Board of Cosmetology and Barbering voted to remove the practical exam entirely, requiring only the written theory exam for licensure, further acknowledging that the two sections have different difficulty and utility profiles.[^19]
2.4 Expert Acknowledgment of the Theory-Practical Gap
The AIR/PBA research identified a structural reason for the practical exam’s higher pass rate: rater leniency. Expert raters in face-to-face practical exams tend to rate more generously, and are “reluctant to fail examinees due to the face-to-face context”. This makes the practical exam artificially easier than it should be, and further concentrates failures on the objective, computer-scored theory exam.[^14]
Industry sources and exam prep providers confirm: “Scientific Concepts is the number one reason people fail” the NIC cosmetology exam, and students who “walk in cold after finishing school are the ones who fail” the written portion.[^18]
2.5 Evidence Strength Assessment — Claim B
| Data Point | Source | Supports Claim? |
| NIC theory pass rate 85%, practical 93.7% | AIR/NIC 2015 study[^14] | Strongly supports direction |
| Derived failure share: ~70% on theory | Calculated from NIC data[^14] | Mathematically supports |
| Scientific Concepts is top failure cause | NIC/SalonExam[17][18] | Supports |
| Practical raters grade leniently | AIR research[^14] | Contextual support |
| California pass rates favor practical over theory | CA Board data[15][20] | Supports |
| Mississippi eliminated practical entirely | MS Board 2026[^19] | Contextual support |
Verdict: The claim that approximately 70% of cosmetology exam failures occur on the theory/written portion is directionally well-supported and mathematically derivable from NIC national data. The ~70% figure is not published as a standalone statistic, but the underlying data (85% theory pass rate vs. 93.7% practical pass rate) generates precisely that ratio when modeling failure distribution. The claim should be cited with proper sourcing using the AIR/NIC methodology.
Section 3: Gaps and Limitations
- No centralized national dataset tracks total licenses issued vs. actively practicing professionals across all 50 states. NIC, BLS, and state boards each measure different things with different scopes.
- Theory vs. practical failure breakdowns are not consistently published by PSI, NIC, or state boards as a percentage of total failures — they are available as separate pass rates, requiring derivation.
- California dropped the practical exam entirely for some license types in 2022, and Mississippi did so in 2026 — meaning the theory/practical comparison is becoming a moving target as states evolve.[19][16]
- The Utah OPLR data is the most rigorous single-state survey on license utilization available, but Utah is not necessarily representative of all states nationally.
- Tips and undercounted income remain a persistent challenge for any earnings-based analysis of cosmetology workforce participation, as noted in recent federal Gainful Employment rule litigation.[^21]
Section 4: Recommendations for Further Validation
To formally validate both claims for regulatory or legislative use:
- File public records/FOIA requests with NIC (nictesting.org) for annual theory vs. practical pass/fail counts, broken down by state and exam cycle.
- Request state board data from Kentucky, Tennessee, Indiana, and Ohio Boards of Cosmetology — specifically: total active licenses vs. renewal addresses linked to active salon employment.
- Replicate the Utah OPLR methodology at the national level by surveying active licensees in multiple states about hours worked, similar to the OPLR’s May 2024 survey.
- Commission a cross-state analysis comparing total licenses issued (from state board databases) against BLS OEWS employed counts in each state, to produce a clean national license utilization ratio.
- Cite the AIR/NIC 2016 report (published by the Professional Beauty Association) as the authoritative source for the theory vs. practical pass rate gap, while noting it uses 2015 data and may need updating via NIC’s current data.
Section 5: Key Sources and Citations
| Source | Relevance | Strength |
| Utah OPLR Cosmetology Report, Jan 2025[^7] | License utilization (32% work 0 hrs, 72% ≤20 hrs) | Primary, survey-based |
| AIR/PBA Cosmetology Licensing Issues Report, 2016[^14] | NIC theory vs. practical pass rates | Primary, statistically significant |
| BLS OEWS May 2023 (SOC 39-5012)[^4] | 294,840 employed cosmetologists | Primary, federal |
| Professional Beauty Association, 2025[^1] | 1.3M licensed professionals | Industry primary |
| Tennessee Board of Cosmetology 2025[^13] | 91,610 active licenses, 3% annual growth | State primary |
| Institute for Justice, 2021[12][9] | $26K average earnings, low graduation rates | Independent research |
| SalonExam.com, 2026[17][18] | NIC exam domain analysis, failure causes | Industry secondary |
| Mississippi Board of Cosmetology, 2026[^19] | Eliminated practical exam | State policy |
| California Board of Barbering and Cosmetology[15][20][^16] | State pass rate data by school and year | State primary |
Both claims are directionally supported by available evidence, with the following nuances:
Claim A (Less than 40% actively using their license): The most direct evidence comes from Utah’s OPLR survey, which found only 17% of active licensees work full-time (30+ hours), with 32% working zero hours. National comparisons of total licensed professionals (~1.3M) against BLS employment counts (~295K–900K depending on scope) reinforce the large utilization gap. For policy and advocacy purposes, this claim is well-supported — the precise number varies by how “actively using” is defined, but full-time active utilization below 40% is defensible.
Claim B (70% of failures are on theory): The claim is mathematically derivable from the authoritative NIC national dataset (85% theory pass rate vs. 93.7% practical pass rate) and confirmed by state-level data patterns. It is directionally accurate and supportable with proper sourcing, though it should be framed as “approximately 70% of exam section failures concentrate on the theory portion” based on NIC pass rate differentials, not a directly published statistic.
Both claims, properly cited and framed, are appropriate for use in policy advocacy, regulatory comments, and legislative testimony related to cosmetology licensing reform.
- Beauty Industry Rallies Against “Devastating” New Federal … – According to PBA, the U.S. beauty industry is made up of more than 1.3 million licensed professional…
- May 12, 2025 The Honorable Jason Smith Chairman, … – The U.S. salon and spa industry is a vital contributor to the American economy and a gateway to entr…
- Economic Snapshot of the Salon Industry – More than 1.3 million professionals work in personal appearance occupations in the United States. In…
- Hairdressers, Hairstylists, and Cosmetologists – 75% 90% Hourly. The percentile wage estimate is the value of a wage below which a certain percent of…
- US Cosmetology Industry: Statistics and Market Overview – The BLS OEWS program reported approximately 670,000 workers employed as hairdressers, hairstylists, …
- Hairdressers, hairstylists, & cosmetologists – The workforce of Hairdressers, hairstylists, & cosmetologists in 2024 was 505,296 people, with 90.7%…
- OPLR Cosmetology Report – Utah Department of Commerce – There are currently 56,766 people with at least one active cosmetology license in the state, more th…
- Barbers, Hairstylists, and Cosmetologists – Overall employment of barbers, hairstylists, and cosmetologists is projected to grow 5 percent from …
- Cosmetology – On average, completing the required classes for a cosmetology license costs more than $16,000, accor…
- Licensure – Kentucky Board of Cosmetology – An inactive license can be renewed/restored provided the license has been expired for less than five…
- 20 CSR 2085-7.040 – Cosmetologist Renewal and Inactive … – (3) Inactive License-A cosmetologist may choose to place his/her license on an inactive status by si…
- New Report Uncovers the Shocking Student Debt Burden … – And in any given year, between 15% and 31% of cosmetology schools saw none of their students graduat…
- Tab 8 Public Chapter 102, Acts of 2025 (Cosmetology and … – licensing average 3% growth for total employment. As of July 2025, there were 91,610 active cosmetol…
- Examination of Cosmetology Licensing Issues – Across states, the average NIC pass rates are consistently higher for the practical section (M = 93….
- How To Find The Exam Pass Rate For Your School and State. – The Nationwide Exam Pass Rate for COSMETOLOGY is 55%. The nationwide Exam Pass Rate for BARBERS is 3…
- Concerning California Barber Exam Pass Rates Reveal … – California has reported a shockingly low barber exam pass rate of 30%. the average pass rate for App…
- Cosmetology Exam Pass Rates by State (2026 Data) – The national cosmetology exam pass rate averages 70-80%. See how pass rates differ by state, what fa…
- Is the Cosmetology Exam Hard? Difficulty & Pass Rates – The cosmetology state board exam has about a 70-80% pass rate nationally. Learn what makes the NIC/P…
- Weeks after Mississippi eliminated its hands-on licensing … – The New Board of Cosmetology and Barbering is re- establishing what it takes to be a licensed cosmet…
- Community College vs. Private Cosmetology School in LA … – 2025 California State Board cosmetology written exam pass rates: Beyond 21st Century Beauty Academy:…
- Congress exempted beauty schools from rules about how … – About 80% of those are for-profit programs, and 45 percent are cosmetology schools. … Number of gr…
Public Disclaimer / Educational Purpose Statement
The following evidence review is shared by Louisville Beauty Academy for educational, workforce-development, and public-policy discussion purposes only.
This document is not intended to attack, diminish, or discredit cosmetology, cosmetologists, beauty professionals, schools, regulators, testing agencies, or any specific licensing board. Louisville Beauty Academy deeply respects the beauty profession and the public-protection purpose of licensing.
The purpose of this review is to ask a constructive workforce question:
Is the modern beauty workforce still being treated as one single license pathway, when today’s industry includes many distinct career pathways — cosmetology, nail technology, esthetics, shampoo styling, eyelash services, instructor training, and more?
The statistics and conclusions discussed in this review are based on publicly available data, third-party reports, federal labor information, state-level studies, and industry sources. Some findings are direct; others are directional, comparative, or mathematically derived from available pass-rate and workforce data. Where exact national data is not available, the review clearly states limitations and recommends further validation.
This review should not be read as a final legal, regulatory, financial, or academic conclusion. It is a good-faith policy and workforce analysis intended to support better discussion around:
Student protection
Affordable education
Right-sized licensing
Workforce alignment
Exam readiness
Debt reduction
Public safety
Career-specific training pathways
Louisville Beauty Academy’s position is simple:
Licensing should protect the public. Education should protect the student. Workforce pathways should match real career use.
We believe the future of beauty education is not about eliminating cosmetology. It is about recognizing that beauty is no longer one license, one pathway, or one career model.
It is a workforce of many specialized pathways — and students deserve clarity, affordability, and honest alignment with the careers they actually intend to pursue.
This review is shared in that spirit.